
Compare games missed, fantasy production and snap-share changes after NFL turf toe injuries, with position-specific sample sizes.
63 recorded episodes · Updated November 11, 2026 · Half-PPR fantasy scoring
How does fantasy production change after return?
| Position | Episodes | Avg games missed | Game 1 | Game 2 | Game 3 | Game 4 | Game 5 | Game 6 |
|---|---|---|---|---|---|---|---|---|
| QB | 8 | 2.1 gamesn=7 | +4.9%n=7 · small sample | +26.7%n=7 · small sample | -14.5%n=5 · small sample | -19.3%n=4 · small sample | -0.9%n=3 · small sample | +40.3%n=2 · small sample |
| RB | 18 | 2.0 gamesn=15 | -44.4%n=14 | -3.9%n=11 | +15.5%n=9 · small sample | +31.7%n=8 · small sample | -8.6%n=6 · small sample | +78.3%n=5 · small sample |
| WR | 28 | 2.8 gamesn=23 | -24.5%n=21 | +3.1%n=18 | +4.2%n=16 | +33.6%n=14 | +25.7%n=11 | +18.9%n=9 · small sample |
| TE | 9 | 2.4 gamesn=9 | -34.8%n=9 · small sample | +89.2%n=6 · small sample | -26.6%n=4 · small sample | +101.0%n=3 · small sample | -0.2%n=3 · small sample | -53.9%n=2 · small sample |
Each game has its own eligible sample. These are historical comparisons, not a prediction for an individual player.
QB: first game back
+4.9% fantasy production change across 7 eligible observations.
2.1 games missed on average across 7 recorded values.
Small sample: interpret cautiously.
RB: first game back
-44.4% fantasy production change across 14 eligible observations.
2.0 games missed on average across 15 recorded values.
WR: first game back
-24.5% fantasy production change across 21 eligible observations.
2.8 games missed on average across 23 recorded values.
TE: first game back
-34.8% fantasy production change across 9 eligible observations.
2.4 games missed on average across 9 recorded values.
Small sample: interpret cautiously.
What the numbers mean for fantasy football
The big toe provides a base for push-off when accelerating and changing direction. Toe pain can affect running and, for quarterbacks, the transfer of force into a throw. Severity and the injured side matter. A player being active does not establish that push-off is comfortable or unrestricted.
Role, age, workload, associated injuries and the type of treatment can all differ between episodes. Read the diagnosis and practice report alongside these data; the averages cannot confirm readiness or a return date.
Shareable first-game comparison
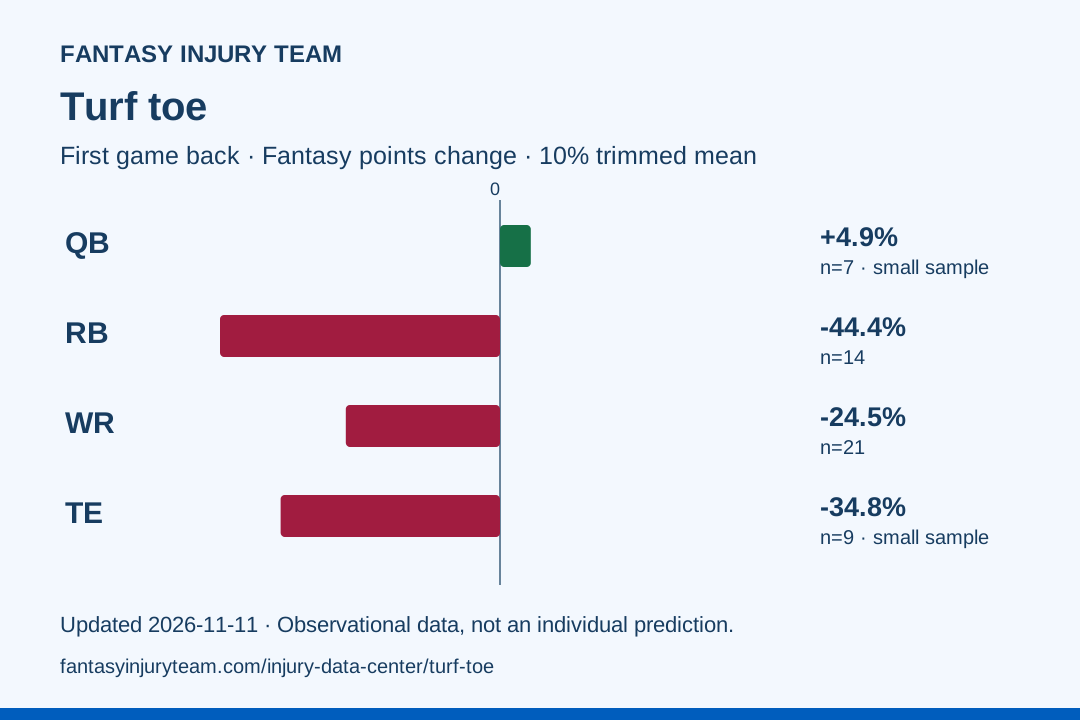
Download this chart · Download summary data
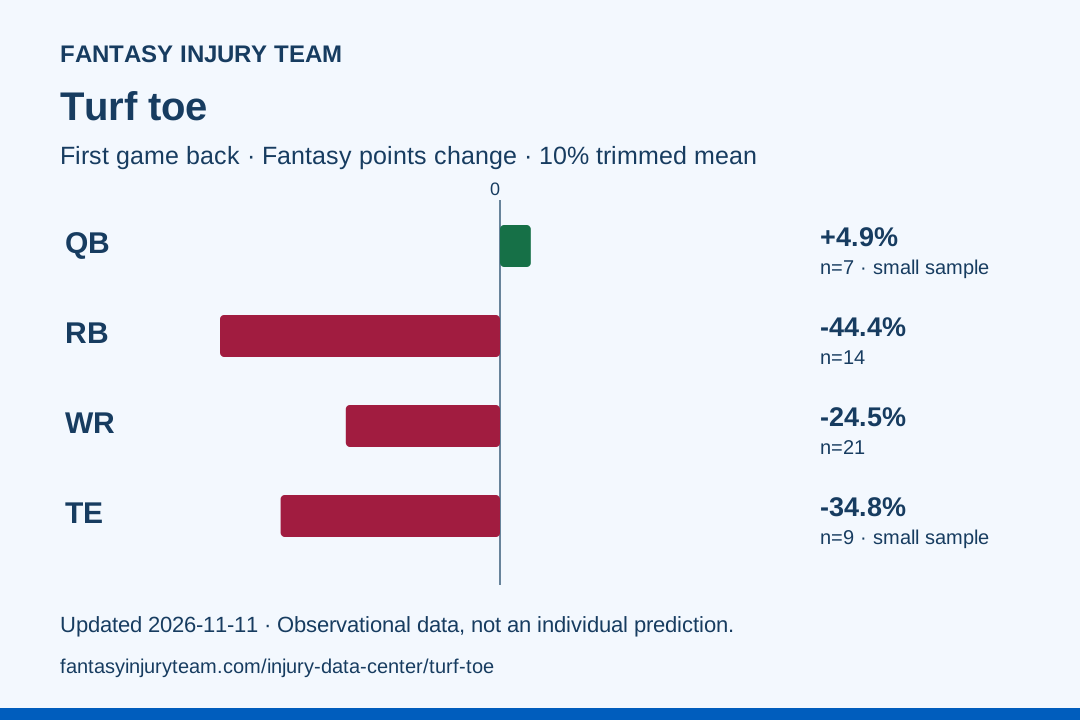
Credit: Fantasy Injury Team. Link to this page when citing the chart; the chart includes the source date and sample sizes.
The people behind the percentages
Individual player episodes
Select a player to expand their injury timeline, baseline, and return-game outcomes.
Aggregate position data · Turf Toe
| Position | Episodes | Avg games missed | Game 1 | Game 2 | Game 3 | Game 4 | Game 5 | Game 6 |
|---|---|---|---|---|---|---|---|---|
| QB | 8 | 2.1 gamesn=7 | +0.5%n=7 · small sample | +1.5%n=7 · small sample | -2.1%n=5 · small sample | -7.4%n=4 · small sample | -0.9%n=3 · small sample | +1.1%n=2 · small sample |
| RB | 18 | 2.0 gamesn=15 | -14.8%n=14 | +6.0%n=11 | -3.5%n=9 · small sample | +12.5%n=8 · small sample | -12.3%n=6 · small sample | -4.3%n=5 · small sample |
| WR | 28 | 2.8 gamesn=23 | -8.7%n=22 | -11.0%n=19 | +2.3%n=17 | +0.1%n=15 | -2.6%n=12 | +8.2%n=9 · small sample |
| TE | 9 | 2.4 gamesn=9 | -12.3%n=9 · small sample | -1.0%n=6 · small sample | -1.3%n=4 · small sample | +0.6%n=3 · small sample | +2.8%n=3 · small sample | -5.3%n=2 · small sample |
9 matching episodes · Turf Toe · TE.
| Player / team | Injury timing | Games missed | G1 snap Δ | G2 snap Δ | G3 snap Δ | G4 snap Δ | G5 snap Δ | G6 snap Δ |
|---|---|---|---|---|---|---|---|---|
Gunnar HelmTurf Toe | 2025 Week 16 | 0.0 | +14.0% | — | — | — | — | — |
Theo JohnsonTurf Toe | 2025 Week 3 | 0.0 | -13.6% | +1.2% | +11.1% | +8.6% | +21.0% | — |
Kyle PittsTurf Toe | 2025 Week 2 | 0.0 | +5.1% | -5.1% | +19.2% | — | — | — |
Tyler WarrenTurf Toe | 2025 Week 2 | 0.0 | -6.8% | +21.9% | -2.7% | +20.5% | +26.0% | +1.4% |
Mo Alie-CoxTurf Toe | 2024 Week 16 | 0.0 | -9.5% | -14.1% | — | — | — | — |
Noah FantTurf Toe | 2024 Week 4 | 0.0 | +3.5% | +3.5% | — | — | — | — |
Michael MayerTurf Toe | 2023 Week 15 | 3.0 | -20.3% | -13.3% | -32.9% | -27.3% | -38.5% | -11.9% |
TJ HockensonTurf Toe | 2020 Week 9 | 0.0 | -7.2% | — | — | — | — | — |
Jordan ReedTurf Toe | 2018 Week 14 | 19.0 | -75.4% | — | — | — | — | — |
Snapshot updated November 11, 2026. All tables use the same 2,413-episode source snapshot. Historical comparisons are observational; they do not establish that an injury caused a particular performance change. Read the methodology and limitations.