
Compare games missed, fantasy production and snap-share changes after NFL toe injuries, including turf toe, with position-specific sample sizes.
75 recorded episodes · Updated November 14, 2026 · Half-PPR fantasy scoring
How does fantasy production change after return?
| Position | Episodes | Avg games missed | Game 1 | Game 2 | Game 3 | Game 4 | Game 5 | Game 6 |
|---|---|---|---|---|---|---|---|---|
| QB | 9 | 2.0 gamesn=8 | +4.9%n=7 · small sample | +26.7%n=7 · small sample | -14.5%n=5 · small sample | -19.3%n=4 · small sample | -0.9%n=3 · small sample | +40.3%n=2 · small sample |
| RB | 22 | 1.7 gamesn=19 | -34.4%n=18 | -3.7%n=13 | +13.3%n=10 | +17.1%n=9 · small sample | -18.0%n=7 · small sample | +56.1%n=6 · small sample |
| WR | 33 | 2.3 gamesn=28 | -19.2%n=26 | -2.8%n=21 | +25.8%n=19 | +26.0%n=17 | +38.2%n=14 | +35.3%n=11 |
| TE | 11 | 2.0 gamesn=11 | -55.8%n=10 | +62.2%n=7 · small sample | -16.8%n=5 · small sample | +55.0%n=4 · small sample | +25.4%n=4 · small sample | -53.9%n=2 · small sample |
Each game has its own eligible sample. These are historical comparisons, not a prediction for an individual player.
QB: first game back
+4.9% fantasy production change across 7 eligible observations.
2.0 games missed on average across 8 recorded values.
Small sample: interpret cautiously.
RB: first game back
-34.4% fantasy production change across 18 eligible observations.
1.7 games missed on average across 19 recorded values.
WR: first game back
-19.2% fantasy production change across 26 eligible observations.
2.3 games missed on average across 28 recorded values.
TE: first game back
-55.8% fantasy production change across 10 eligible observations.
2.0 games missed on average across 11 recorded values.
What the numbers mean for fantasy football
This combined category includes turf toe and other recorded toe injuries; individual diagnoses remain available in the episode details. The big toe provides a base for push-off when accelerating and changing direction. Toe pain can affect running and, for quarterbacks, the transfer of force into a throw. Severity and the injured side matter. A player being active does not establish that push-off is comfortable or unrestricted.
Role, age, workload, associated injuries and the type of treatment can all differ between episodes. Read the diagnosis and practice report alongside these data; the averages cannot confirm readiness or a return date.
Shareable first-game comparison
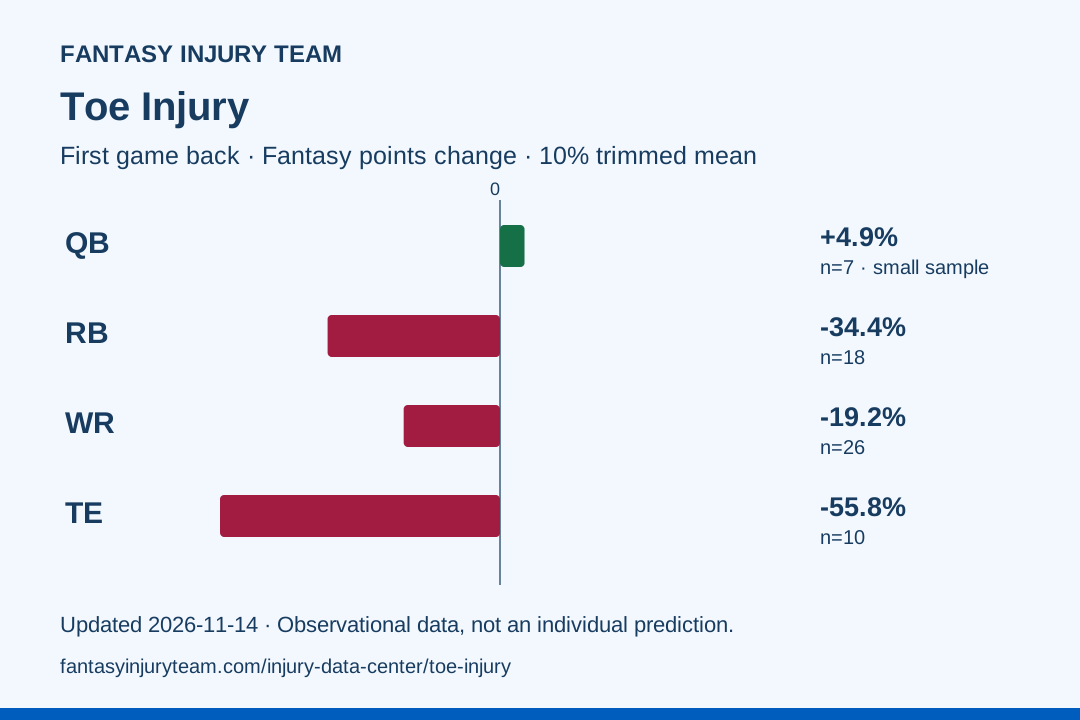
Download this chart · Download summary data
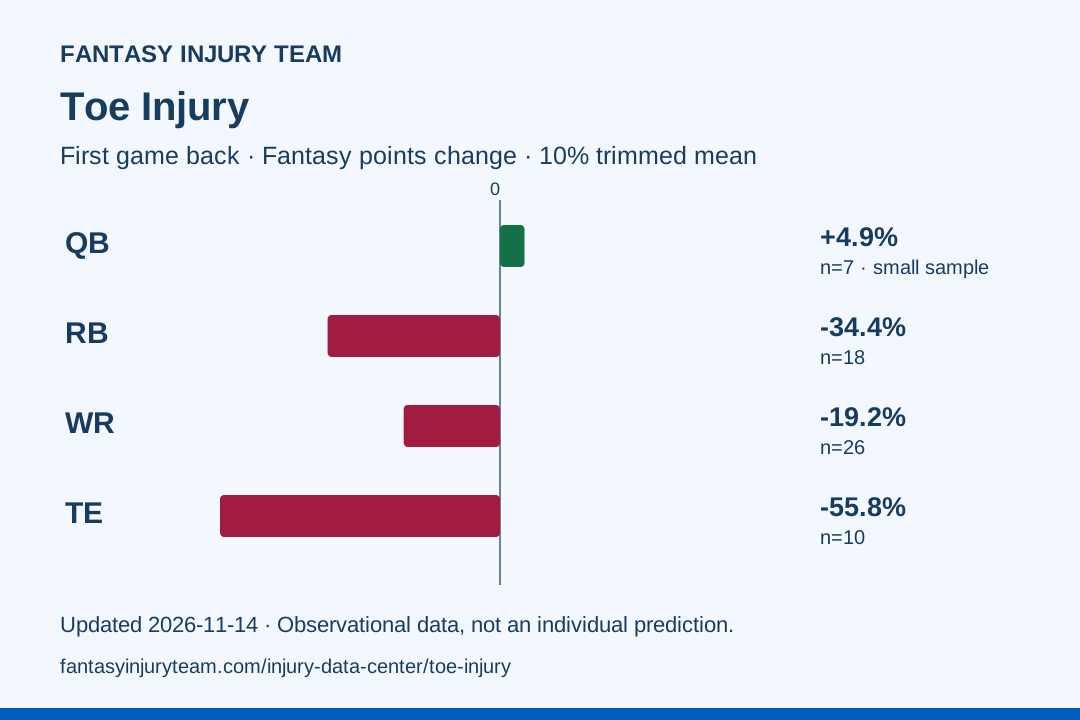
Credit: Fantasy Injury Team. Link to this page when citing the chart; the chart includes the source date and sample sizes.
The people behind the percentages
Individual player episodes
Select a player to expand their injury timeline, baseline, and return-game outcomes.
Aggregate position data · Toe Injury
| Position | Episodes | Avg games missed | Game 1 | Game 2 | Game 3 | Game 4 | Game 5 | Game 6 |
|---|---|---|---|---|---|---|---|---|
| QB | 9 | 2.0 gamesn=8 | +0.5%n=7 · small sample | +1.5%n=7 · small sample | -2.1%n=5 · small sample | -7.4%n=4 · small sample | -0.9%n=3 · small sample | +1.1%n=2 · small sample |
| RB | 22 | 1.7 gamesn=19 | -14.1%n=18 | +11.5%n=13 | -5.9%n=10 | +9.3%n=9 · small sample | +13.3%n=7 · small sample | +3.3%n=6 · small sample |
| WR | 33 | 2.3 gamesn=28 | -4.9%n=27 | -2.3%n=22 | +7.1%n=20 | +10.6%n=18 | +6.2%n=15 | +8.0%n=11 |
| TE | 11 | 2.0 gamesn=11 | -11.6%n=11 | +0.0%n=7 · small sample | -0.3%n=5 · small sample | +11.2%n=4 · small sample | +7.7%n=4 · small sample | -5.3%n=2 · small sample |
11 matching episodes · Toe Injury · TE.
| Player / team | Injury timing | Games missed | G1 snap Δ | G2 snap Δ | G3 snap Δ | G4 snap Δ | G5 snap Δ | G6 snap Δ |
|---|---|---|---|---|---|---|---|---|
E.J. JenkinsToe injury; side and specific tissue not reported | 2026 Week 6 | 0.0 | -70.0% | — | — | — | — | — |
Darren WallerToe injury; side and tissue diagnosis not reported | 2026 Week 4 | 0.0 | +22.3% | +6.2% | +3.8% | +43.1% | +22.3% | — |
Gunnar HelmTurf Toe | 2025 Week 16 | 0.0 | +14.0% | — | — | — | — | — |
Theo JohnsonTurf Toe | 2025 Week 3 | 0.0 | -13.6% | +1.2% | +11.1% | +8.6% | +21.0% | — |
Kyle PittsTurf Toe | 2025 Week 2 | 0.0 | +5.1% | -5.1% | +19.2% | — | — | — |
Tyler WarrenTurf Toe | 2025 Week 2 | 0.0 | -6.8% | +21.9% | -2.7% | +20.5% | +26.0% | +1.4% |
Mo Alie-CoxTurf Toe | 2024 Week 16 | 0.0 | -9.5% | -14.1% | — | — | — | — |
Noah FantTurf Toe | 2024 Week 4 | 0.0 | +3.5% | +3.5% | — | — | — | — |
Michael MayerTurf Toe | 2023 Week 15 | 3.0 | -20.3% | -13.3% | -32.9% | -27.3% | -38.5% | -11.9% |
TJ HockensonTurf Toe | 2020 Week 9 | 0.0 | -7.2% | — | — | — | — | — |
Jordan ReedTurf Toe | 2018 Week 14 | 19.0 | -75.4% | — | — | — | — | — |
Snapshot updated November 14, 2026. All tables use the same 2,414-episode source snapshot. Historical comparisons are observational; they do not establish that an injury caused a particular performance change. Read the methodology and limitations.