
Explore NFL high ankle sprain recovery data: games missed and fantasy performance after return, broken down by position and sample size.
148 recorded episodes · Updated November 11, 2026 · Half-PPR fantasy scoring
How does fantasy production change after return?
| Position | Episodes | Avg games missed | Game 1 | Game 2 | Game 3 | Game 4 | Game 5 | Game 6 |
|---|---|---|---|---|---|---|---|---|
| QB | 26 | 3.1 gamesn=23 | -10.1%n=23 | +7.0%n=20 | -8.6%n=15 | +14.5%n=12 | +21.6%n=11 | -18.7%n=9 · small sample |
| RB | 60 | 2.4 gamesn=57 | -8.0%n=52 | -9.7%n=44 | -4.0%n=39 | +6.6%n=31 | -1.7%n=26 | -13.9%n=23 |
| WR | 51 | 2.6 gamesn=41 | -6.3%n=39 | -13.6%n=32 | -9.0%n=26 | -29.3%n=23 | -39.1%n=19 | -33.9%n=13 |
| TE | 11 | 4.6 gamesn=8 | -34.8%n=8 · small sample | +167.3%n=7 · small sample | +14.2%n=7 · small sample | +120.2%n=6 · small sample | +21.1%n=6 · small sample | -77.0%n=4 · small sample |
Each game has its own eligible sample. These are historical comparisons, not a prediction for an individual player.
QB: first game back
-10.1% fantasy production change across 23 eligible observations.
3.1 games missed on average across 23 recorded values.
RB: first game back
-8.0% fantasy production change across 52 eligible observations.
2.4 games missed on average across 57 recorded values.
WR: first game back
-6.3% fantasy production change across 39 eligible observations.
2.6 games missed on average across 41 recorded values.
TE: first game back
-34.8% fantasy production change across 8 eligible observations.
4.6 games missed on average across 8 recorded values.
Small sample: interpret cautiously.
What the numbers mean for fantasy football
High ankle sprains can affect the stability needed for planting, cutting and pushing off. Recovery depends on the specific injury and the demands of the player's role. A player may return while still managing stiffness or discomfort; historical performance is useful context, not a clearance decision.
Role, age, workload, associated injuries and the type of treatment can all differ between episodes. Read the diagnosis and practice report alongside these data; the averages cannot confirm readiness or a return date.
Shareable first-game comparison
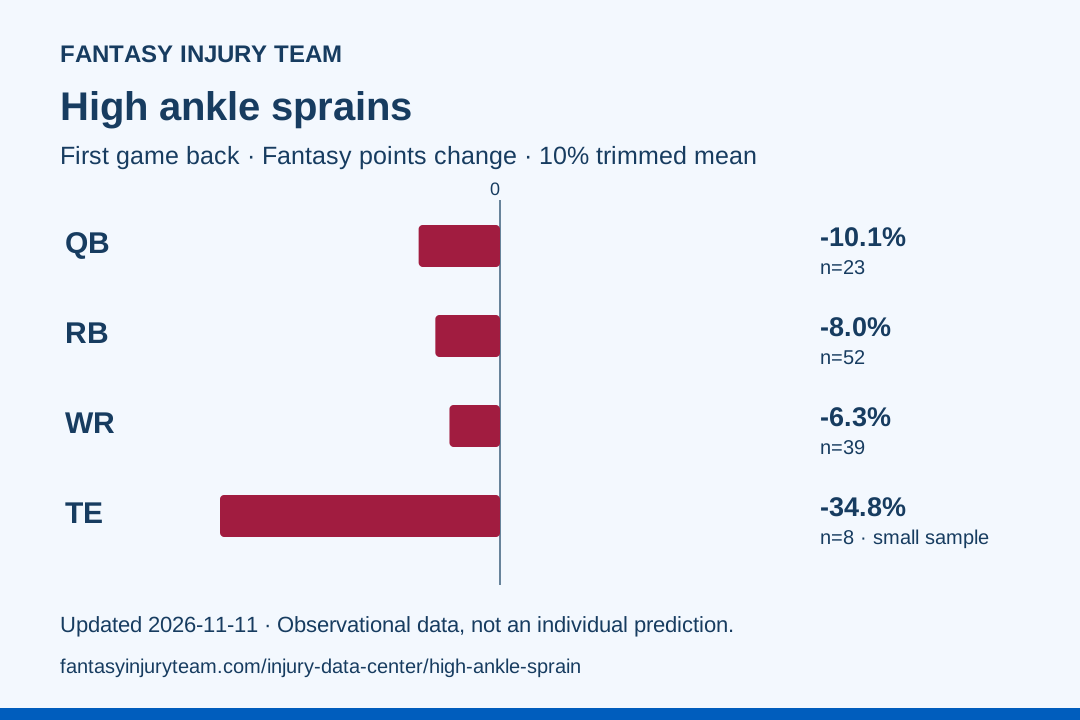
Download this chart · Download summary data
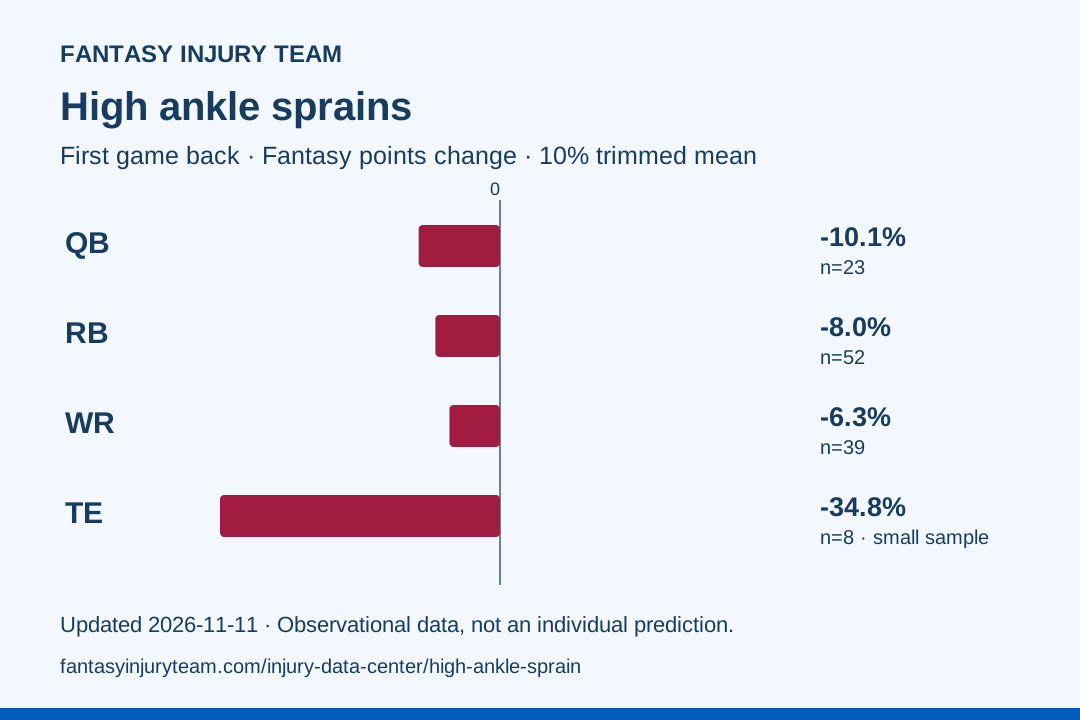
Credit: Fantasy Injury Team. Link to this page when citing the chart; the chart includes the source date and sample sizes.
The people behind the percentages
Individual player episodes
Select a player to expand their injury timeline, baseline, and return-game outcomes.
Aggregate position data · High Ankle Sprain
| Position | Episodes | Avg games missed | Game 1 | Game 2 | Game 3 | Game 4 | Game 5 | Game 6 |
|---|---|---|---|---|---|---|---|---|
| QB | 26 | 3.1 gamesn=23 | -2.4%n=23 | +1.2%n=20 | +0.5%n=15 | +1.9%n=12 | +0.9%n=11 | -4.3%n=9 · small sample |
| RB | 60 | 2.4 gamesn=57 | -5.6%n=53 | +12.8%n=44 | +10.9%n=39 | -0.5%n=31 | +8.0%n=26 | +5.8%n=23 |
| WR | 51 | 2.6 gamesn=41 | -11.7%n=40 | -0.6%n=33 | -0.8%n=27 | -5.3%n=23 | -1.9%n=19 | -1.5%n=13 |
| TE | 11 | 4.6 gamesn=8 | -13.5%n=8 · small sample | +27.9%n=7 · small sample | +47.4%n=7 · small sample | +52.4%n=6 · small sample | +68.2%n=6 · small sample | +66.0%n=4 · small sample |
148 matching episodes · High Ankle Sprain · All positions.
| Player / team | Injury timing | Games missed | G1 snap Δ | G2 snap Δ | G3 snap Δ | G4 snap Δ | G5 snap Δ | G6 snap Δ |
|---|---|---|---|---|---|---|---|---|
Christian WatsonHigh Ankle Sprain | 2024 Week 4 | 1.0 | +2.3% | -9.7% | +26.1% | -2.8% | +14.2% | +10.8% |
Khalil ShakirHigh Ankle Sprain | 2024 Week 4 | 1.0 | -35.6% | +16.9% | -1.7% | -10.2% | +22.0% | +20.3% |
Cooper KuppHigh Ankle Sprain | 2024 Week 2 | 4.0 | -42.0% | -8.0% | -10.0% | -29.0% | -5.0% | -9.0% |
Jauan JenningsHigh Ankle Sprain | 2024 Week 1 | 0.0 | +19.6% | +88.2% | +26.2% | — | — | — |
Jameson WilliamsHigh Ankle Sprain | 2024 Week 1 | 0.0 | +70.9% | +33.3% | +80.3% | +40.8% | +40.8% | +39.0% |
Jordan AddisonHigh Ankle Sprain | 2024 Week 1 | 2.0 | -18.6% | +9.8% | +4.9% | +13.5% | +13.5% | -8.7% |
Jordan AddisonHigh Ankle Sprain | 2024 Preseason | — | — | — | — | — | — | — |
Josh DownsHigh Ankle Sprain | 2024 Preseason | 2.0 | -15.6% | — | — | — | — | — |
Devonta SmithHigh Ankle Sprain | 2023 Week 17 | 1.0 | +3.2% | +3.2% | — | — | — | — |
Tyreek HillHigh Ankle Sprain | 2023 Week 17 | 0.0 | +16.2% | — | — | — | — | — |
DJ MooreHigh Ankle Sprain | 2023 Week 16 | 0.0 | -12.5% | -2.8% | — | — | — | — |
Jaylen WaddleHigh Ankle Sprain | 2023 Week 16 | — | — | — | — | — | — | — |
Tyreek HillHigh Ankle Sprain | 2023 Week 14 | 1.0 | +28.1% | — | — | — | — | — |
Laviska ShenaultHigh Ankle Sprain | 2023 Week 6 | 3.0 | -76.2% | -85.7% | — | — | — | — |
Deandre HopkinsHigh Ankle Sprain | 2023 Week 1 | 0.0 | -31.9% | -17.2% | -39.8% | -5.8% | — | — |
Deebo SamuelHigh Ankle Sprain | 2022 Week 14 | 3.0 | -14.4% | — | — | — | — | — |
Mike WilliamsHigh Ankle Sprain | 2022 Week 11 | 2.0 | -26.5% | +0.6% | -3.9% | -11.8% | -58.2% | — |
Cooper KuppHigh Ankle Sprain | 2022 Week 10 | — | — | — | — | — | — | — |
Romeo DoubsHigh Ankle Sprain | 2022 Week 9 | 4.0 | -59.5% | -22.8% | -38.0% | -51.9% | — | — |
Mike WilliamsHigh Ankle Sprain | 2022 Week 7 | — | — | — | — | — | — | — |
Randall CobbHigh Ankle Sprain | 2022 Week 6 | 4.0 | +23.3% | -0.9% | +10.1% | -9.7% | +5.7% | +1.3% |
N'keal HarryHigh Ankle Sprain | 2022 Preseason | 6.0 | -0.8% | +48.8% | -33.9% | — | — | — |
Adam ThielenHigh Ankle Sprain | 2021 Week 16 | 2.0 | +8.1% | +10.3% | +10.3% | +10.3% | +9.2% | -1.0% |
Adam ThielenHigh Ankle Sprain | 2021 Week 13 | — | — | — | — | — | — | — |
Jerry JeudyHigh Ankle Sprain | 2021 Week 1 | 6.0 | -3.2% | -19.3% | +4.9% | -24.7% | -1.8% | -19.3% |
Michael ThomasHigh Ankle Sprain | 2021 Season | — | — | — | — | — | — | — |
Brandon AiyukHigh Ankle Sprain | 2020 Week 16 | 1.0 | -45.5% | -37.3% | -0.2% | -22.3% | -17.6% | -17.6% |
Terry McLaurinHigh Ankle Sprain | 2020 Week 15 | 1.0 | -13.6% | — | — | — | — | — |
Michael ThomasHigh Ankle Sprain | 2020 Week 14 | — | — | — | — | — | — | — |
John BrownHigh Ankle Sprain | 2020 Week 10 | 5.0 | -42.5% | — | — | — | — | — |
Desean JacksonHigh Ankle Sprain | 2020 Week 7 | — | — | — | — | — | — | — |
Chris HoganHigh Ankle Sprain | 2020 Week 5 | 11.0 | -73.7% | -58.9% | -70.3% | -76.0% | -84.0% | — |
Michael ThomasHigh Ankle Sprain | 2020 Week 1 | 6.0 | -37.7% | -11.7% | -3.8% | -24.1% | -32.1% | — |
TY HiltonHigh Ankle Sprain | 2018 Week 14 | 0.0 | -27.7% | +10.4% | +2.8% | — | — | — |
Quincy EnunwaHigh Ankle Sprain | 2018 Week 6 | 2.0 | -9.4% | +19.1% | +16.6% | +7.9% | +0.5% | — |
Jamison CrowderHigh Ankle Sprain | 2018 Week 5 | 7.0 | -11.1% | +20.8% | -13.9% | — | — | — |
Odell Beckham Jr.High Ankle Sprain | 2017 Preseason | 1.0 | -35.4% | -16.3% | — | — | — | — |
Grant CalcaterraHigh Ankle Sprain | 2025 Week 18 | — | — | — | — | — | — | — |
Ja'Tavion SandersHigh Ankle Sprain | 2025 Week 3 | 3.0 | -41.7% | -15.0% | -21.3% | -43.3% | -24.4% | -10.2% |
Mason TaylorHigh Ankle Sprain | 2025 Preseason | — | — | — | — | — | — | — |
David NjokuHigh Ankle Sprain | 2024 Week 1 | — | — | — | — | — | — | — |
Irv SmithHigh Ankle Sprain | 2022 Week 8 | 9.0 | -17.7% | — | — | — | — | — |
David NjokuHigh Ankle Sprain | 2022 Week 7 | 2.0 | -58.0% | -8.0% | +9.1% | +6.8% | +10.2% | +5.7% |
Zach ErtzHigh Ankle Sprain | 2020 Week 6 | 5.0 | -52.3% | -21.9% | -18.7% | -7.8% | -2.4% | — |
Jordan AkinsHigh Ankle Sprain | 2020 Week 4 | 3.0 | -56.0% | -45.7% | -34.1% | -40.5% | -9.5% | -28.9% |
Drew SampleHigh Ankle Sprain | 2019 Week 10 | 7.0 | +85.4% | +212.6% | +371.5% | +350.3% | +398.0% | +297.4% |
OJ HowardHigh Ankle Sprain | 2018 Week 11 | 6.0 | +35.3% | +55.6% | +26.9% | +48.9% | +37.0% | — |
OJ HowardHigh Ankle Sprain | 2017 Week 15 | 2.0 | -3.3% | +17.5% | -1.8% | — | — | — |
Snapshot updated November 11, 2026. All tables use the same 2,413-episode source snapshot. Historical comparisons are observational; they do not establish that an injury caused a particular performance change. Read the methodology and limitations.