
Explore NFL high ankle sprain recovery data: games missed and fantasy performance after return, broken down by position and sample size.
148 recorded episodes · Updated November 11, 2026 · Half-PPR fantasy scoring
How does fantasy production change after return?
| Position | Episodes | Avg games missed | Game 1 | Game 2 | Game 3 | Game 4 | Game 5 | Game 6 |
|---|---|---|---|---|---|---|---|---|
| QB | 26 | 3.1 gamesn=23 | -10.1%n=23 | +7.0%n=20 | -8.6%n=15 | +14.5%n=12 | +21.6%n=11 | -18.7%n=9 · small sample |
| RB | 60 | 2.4 gamesn=57 | -8.0%n=52 | -9.7%n=44 | -4.0%n=39 | +6.6%n=31 | -1.7%n=26 | -13.9%n=23 |
| WR | 51 | 2.6 gamesn=41 | -6.3%n=39 | -13.6%n=32 | -9.0%n=26 | -29.3%n=23 | -39.1%n=19 | -33.9%n=13 |
| TE | 11 | 4.6 gamesn=8 | -34.8%n=8 · small sample | +167.3%n=7 · small sample | +14.2%n=7 · small sample | +120.2%n=6 · small sample | +21.1%n=6 · small sample | -77.0%n=4 · small sample |
Each game has its own eligible sample. These are historical comparisons, not a prediction for an individual player.
QB: first game back
-10.1% fantasy production change across 23 eligible observations.
3.1 games missed on average across 23 recorded values.
RB: first game back
-8.0% fantasy production change across 52 eligible observations.
2.4 games missed on average across 57 recorded values.
WR: first game back
-6.3% fantasy production change across 39 eligible observations.
2.6 games missed on average across 41 recorded values.
TE: first game back
-34.8% fantasy production change across 8 eligible observations.
4.6 games missed on average across 8 recorded values.
Small sample: interpret cautiously.
What the numbers mean for fantasy football
High ankle sprains can affect the stability needed for planting, cutting and pushing off. Recovery depends on the specific injury and the demands of the player's role. A player may return while still managing stiffness or discomfort; historical performance is useful context, not a clearance decision.
Role, age, workload, associated injuries and the type of treatment can all differ between episodes. Read the diagnosis and practice report alongside these data; the averages cannot confirm readiness or a return date.
Shareable first-game comparison
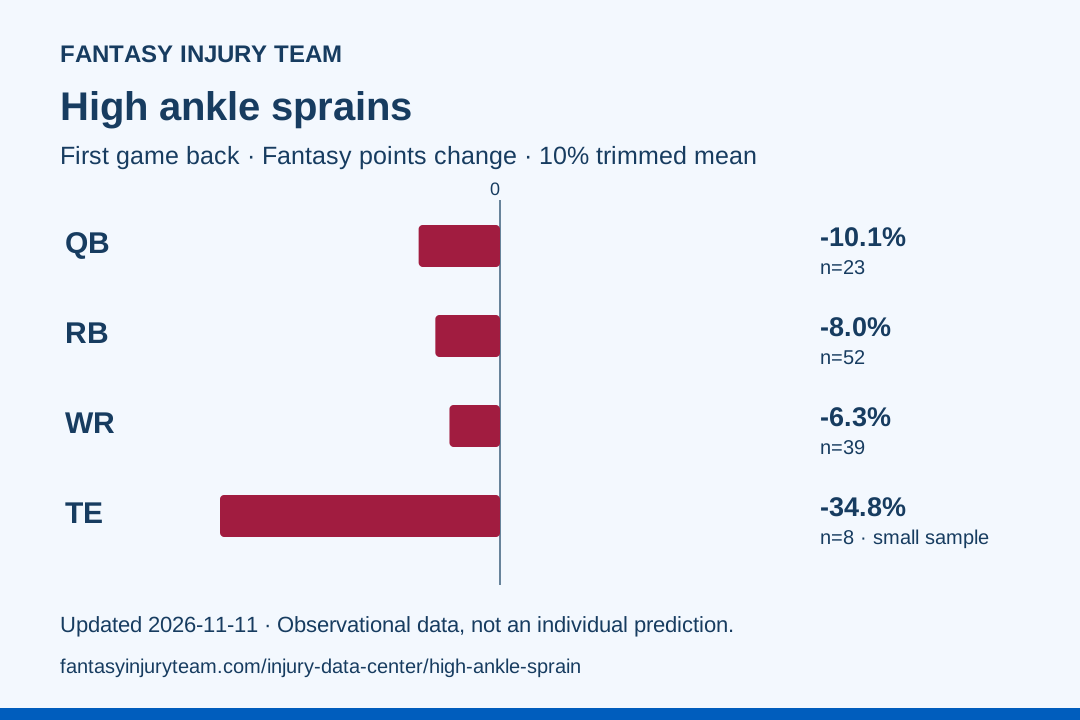
Download this chart · Download summary data
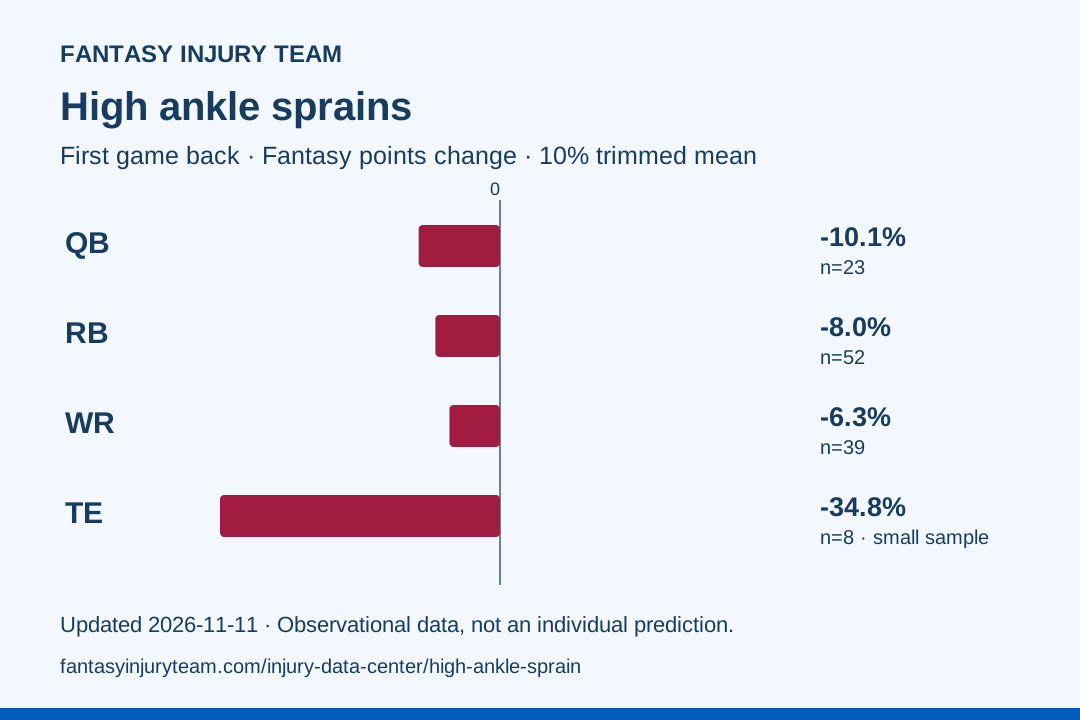
Credit: Fantasy Injury Team. Link to this page when citing the chart; the chart includes the source date and sample sizes.
The people behind the percentages
Individual player episodes
Select a player to expand their injury timeline, baseline, and return-game outcomes.
Aggregate position data · High Ankle Sprain
| Position | Episodes | Avg games missed | Game 1 | Game 2 | Game 3 | Game 4 | Game 5 | Game 6 |
|---|---|---|---|---|---|---|---|---|
| QB | 26 | 3.1 gamesn=23 | -10.1%n=23 | +7.0%n=20 | -8.6%n=15 | +14.5%n=12 | +21.6%n=11 | -18.7%n=9 · small sample |
| RB | 60 | 2.4 gamesn=57 | -8.0%n=52 | -9.7%n=44 | -4.0%n=39 | +6.6%n=31 | -1.7%n=26 | -13.9%n=23 |
| WR | 51 | 2.6 gamesn=41 | -6.3%n=39 | -13.6%n=32 | -9.0%n=26 | -29.3%n=23 | -39.1%n=19 | -33.9%n=13 |
| TE | 11 | 4.6 gamesn=8 | -34.8%n=8 · small sample | +167.3%n=7 · small sample | +14.2%n=7 · small sample | +120.2%n=6 · small sample | +21.1%n=6 · small sample | -77.0%n=4 · small sample |
60 matching episodes · High Ankle Sprain · RB.
| Player / team | Injury timing | Games missed | G1 PPG Δ | G2 PPG Δ | G3 PPG Δ | G4 PPG Δ | G5 PPG Δ | G6 PPG Δ |
|---|---|---|---|---|---|---|---|---|
TreVeyon HendersonRight high ankle sprain | 2026 Week 5 | 0.0 | -64.6% | -53.3% | — | — | — | — |
Jeremiyah LoveLeft high ankle sprain | 2026 Preseason | 0.0 | — | — | — | — | — | — |
Blake CorumHigh Ankle Sprain | 2025 Week 17 | 0.0 | -25.7% | — | — | — | — | — |
Ashton JeantyHigh Ankle Sprain | 2025 Week 12 | 0.0 | -27.9% | -62.0% | -50.9% | +148.0% | -34.2% | -13.6% |
Bhayshul TutenHigh Ankle Sprain | 2025 Week 11 | 0.0 | -65.6% | +69.9% | -130.3% | — | — | — |
Emari DemercadoHigh Ankle Sprain | 2025 Week 11 | 3.0 | -78.3% | -40.8% | -40.8% | +22.3% | — | — |
Samaje PerineHigh Ankle Sprain | 2025 Week 9 | 2.0 | +18.1% | +15.4% | +28.9% | +198.0% | +109.4% | +79.9% |
Ollie GordonHigh Ankle Sprain | 2025 Week 9 | 0.0 | -108.3% | +191.7% | -72.2% | +113.9% | — | — |
Alvin KamaraHigh Ankle Sprain | 2025 Week 8 | 0.0 | -97.8% | — | — | — | — | — |
Kareem HuntHigh Ankle Sprain | 2025 Week 7 | 0.0 | +119.3% | +57.5% | +66.7% | +142.9% | +11.6% | +18.2% |
Tyjae SpearsHigh Ankle Sprain | 2025 Preseason | 4.0 | -83.0% | -14.8% | -33.1% | +91.1% | -6.3% | -28.2% |
Chase BrownHigh Ankle Sprain | 2024 Week 17 | 1.0 | -16.3% | -48.1% | -72.3% | -40.5% | -42.6% | -45.4% |
Jordan MasonHigh Ankle Sprain | 2024 Week 13 | 6.0 | -13.5% | -48.1% | +155.3% | -5.9% | +20.1% | +26.5% |
Najee HarrisHigh Ankle Sprain | 2024 Week 10 | 0.0 | -4.7% | -46.0% | +84.6% | -4.7% | -78.1% | -64.6% |
Jonathan TaylorHigh Ankle Sprain | 2024 Week 4 | 3.0 | +6.4% | -56.7% | -22.8% | -62.0% | -79.5% | -1.8% |
Joe MixonHigh Ankle Sprain | 2024 Week 2 | 3.0 | +3.6% | +0.4% | -15.4% | -34.4% | -36.8% | +35.6% |
De'Von AchaneHigh Ankle Sprain | 2024 Week 1 | 0.0 | +61.4% | -54.7% | -72.7% | — | — | — |
Alvin KamaraHigh Ankle Sprain | 2023 Week 17 | 1.0 | +23.4% | — | — | — | — | — |
Rhamondre StevensonHigh Ankle Sprain | 2023 Week 13 | 5.0 | +77.9% | +41.6% | -97.3% | — | — | — |
D'Onta ForemanHigh Ankle Sprain | 2023 Week 11 | 1.0 | -30.4% | -105.1% | — | — | — | — |
Saquon BarkleyHigh Ankle Sprain | 2023 Week 10 | 0.0 | +90.5% | -61.2% | +46.9% | -68.0% | +21.8% | -50.3% |
Jerome FordHigh Ankle Sprain | 2023 Week 7 | 0.0 | -64.2% | -16.9% | -7.2% | -11.2% | -19.4% | +3.4% |
Kyren WilliamsHigh Ankle Sprain | 2023 Week 6 | 4.0 | +113.8% | +12.9% | -22.7% | +32.9% | -1.0% | +75.7% |
Khalil HerbertHigh Ankle Sprain | 2023 Week 5 | 5.0 | -47.6% | -50.6% | -91.8% | -82.5% | +91.3% | — |
Saquon BarkleyHigh Ankle Sprain | 2023 Week 2 | 3.0 | +51.3% | +121.8% | +83.3% | +64.1% | — | — |
Austin EkelerHigh Ankle Sprain | 2023 Week 1 | 3.0 | -56.3% | — | — | — | — | — |
Jonathan TaylorHigh Ankle Sprain | 2022 Week 15 | 7.0 | -70.1% | -31.1% | +49.3% | -21.9% | +17.9% | +7.2% |
Rhamondre StevensonHigh Ankle Sprain | 2022 Week 14 | 0.0 | +68.3% | -83.7% | -56.9% | -24.3% | — | — |
Dameon PierceHigh Ankle Sprain | 2022 Week 14 | 4.0 | -51.0% | -61.3% | +15.2% | — | — | — |
DeeJay DallasHigh Ankle Sprain | 2022 Week 13 | 2.0 | +480.6% | +811.3% | +150.0% | — | — | — |
Chase EdmondsHigh Ankle Sprain | 2022 Week 11 | 4.0 | +23.3% | +72.2% | -12.0% | — | — | — |
Clyde Edwards-HelaireHigh Ankle Sprain | 2022 Week 11 | 7.0 | -65.6% | -72.7% | +23.5% | -81.8% | -96.0% | -78.7% |
Jonathan TaylorHigh Ankle Sprain | 2022 Week 8 | 1.0 | +101.9% | +29.1% | +49.9% | +2.3% | — | — |
Jonathan TaylorHigh Ankle Sprain | 2022 Week 4 | 2.0 | -16.1% | — | — | — | — | — |
David MontgomeryHigh Ankle Sprain | 2022 Week 3 | 1.0 | +53.6% | -19.4% | +15.6% | -33.6% | -53.6% | -53.6% |
Tyrion Davis-PriceHigh Ankle Sprain | 2022 Week 2 | 3.0 | — | — | — | — | — | — |
Kyren WilliamsHigh Ankle Sprain | 2022 Week 1 | 7.0 | — | — | — | — | — | — |
Joe MixonHigh Ankle Sprain | 2021 Week 15 | 0.0 | +68.6% | -28.4% | — | — | — | — |
Michael CarterHigh Ankle Sprain | 2021 Week 11 | 3.0 | -78.5% | +15.1% | — | — | — | — |
Cordarrelle PattersonHigh Ankle Sprain | 2021 Week 10 | 1.0 | +57.4% | -34.1% | -23.4% | -80.4% | -53.7% | -63.2% |
Chase EdmondsHigh Ankle Sprain | 2021 Week 9 | 4.0 | -48.8% | — | — | — | — | — |
JaMycal HastyHigh Ankle Sprain | 2021 Week 2 | 3.0 | -62.7% | -48.2% | -66.3% | -100.0% | -69.9% | -74.7% |
Darrell HendersonHigh Ankle Sprain | 2020 Week 16 | — | — | — | — | — | — | — |
Cam AkersHigh Ankle Sprain | 2020 Week 15 | 1.0 | — | — | — | — | — | — |
Clyde Edwards-HelaireHigh Ankle Sprain | 2020 Week 15 | — | — | — | — | — | — | — |
Raheem MostertHigh Ankle Sprain | 2020 Week 15 | — | — | — | — | — | — | — |
Damien HarrisHigh Ankle Sprain | 2020 Week 14 | 3.0 | +15.6% | — | — | — | — | — |
Jeff Wilson Jr.High Ankle Sprain | 2020 Week 7 | 3.0 | -69.0% | +7.0% | +38.0% | +86.0% | +317.1% | +245.7% |
Kenyan DrakeHigh Ankle Sprain | 2020 Week 7 | 1.0 | -26.8% | +9.1% | +77.7% | — | — | — |
Devonta FreemanHigh Ankle Sprain | 2020 Week 7 | 11.0 | -63.4% | -89.9% | -95.0% | -36.9% | +42.6% | +43.8% |
Snapshot updated November 11, 2026. All tables use the same 2,413-episode source snapshot. Historical comparisons are observational; they do not establish that an injury caused a particular performance change. Read the methodology and limitations.