
Compare fantasy points, snap share and games missed after NFL hamstring injuries, with receiver, running back, quarterback and tight end data.
391 recorded episodes · Updated November 11, 2026 · Half-PPR fantasy scoring
How does fantasy production change after return?
| Position | Episodes | Avg games missed | Game 1 | Game 2 | Game 3 | Game 4 | Game 5 | Game 6 |
|---|---|---|---|---|---|---|---|---|
| QB | 17 | 2.1 gamesn=14 | -35.6%n=10 | -55.4%n=8 · small sample | -26.4%n=7 · small sample | -63.4%n=4 · small sample | -48.5%n=3 · small sample | -97.5%n=2 · small sample |
| RB | 104 | 1.8 gamesn=82 | +11.1%n=71 | +19.2%n=57 | +25.0%n=41 | -0.7%n=31 | -1.5%n=26 | +15.4%n=19 |
| WR | 220 | 1.6 gamesn=168 | -23.8%n=135 | -3.0%n=112 | -0.9%n=77 | +9.3%n=60 | -1.1%n=43 | +8.5%n=36 |
| TE | 50 | 2.9 gamesn=43 | -25.7%n=38 | -33.2%n=31 | +16.3%n=25 | -29.7%n=22 | -11.1%n=15 | -3.9%n=14 |
Each game has its own eligible sample. These are historical comparisons, not a prediction for an individual player.
QB: first game back
-35.6% fantasy production change across 10 eligible observations.
2.1 games missed on average across 14 recorded values.
RB: first game back
+11.1% fantasy production change across 71 eligible observations.
1.8 games missed on average across 82 recorded values.
WR: first game back
-23.8% fantasy production change across 135 eligible observations.
1.6 games missed on average across 168 recorded values.
TE: first game back
-25.7% fantasy production change across 38 eligible observations.
2.9 games missed on average across 43 recorded values.
What the numbers mean for fantasy football
Hamstrings take on substantial load during sprinting. Pain or weakness can limit acceleration and separation, especially for receivers who depend on speed. A return to the lineup does not necessarily mean a return to full explosiveness. Compare the first game back with later games rather than treating every return as the same.
Role, age, workload, associated injuries and the type of treatment can all differ between episodes. Read the diagnosis and practice report alongside these data; the averages cannot confirm readiness or a return date.
Shareable first-game comparison
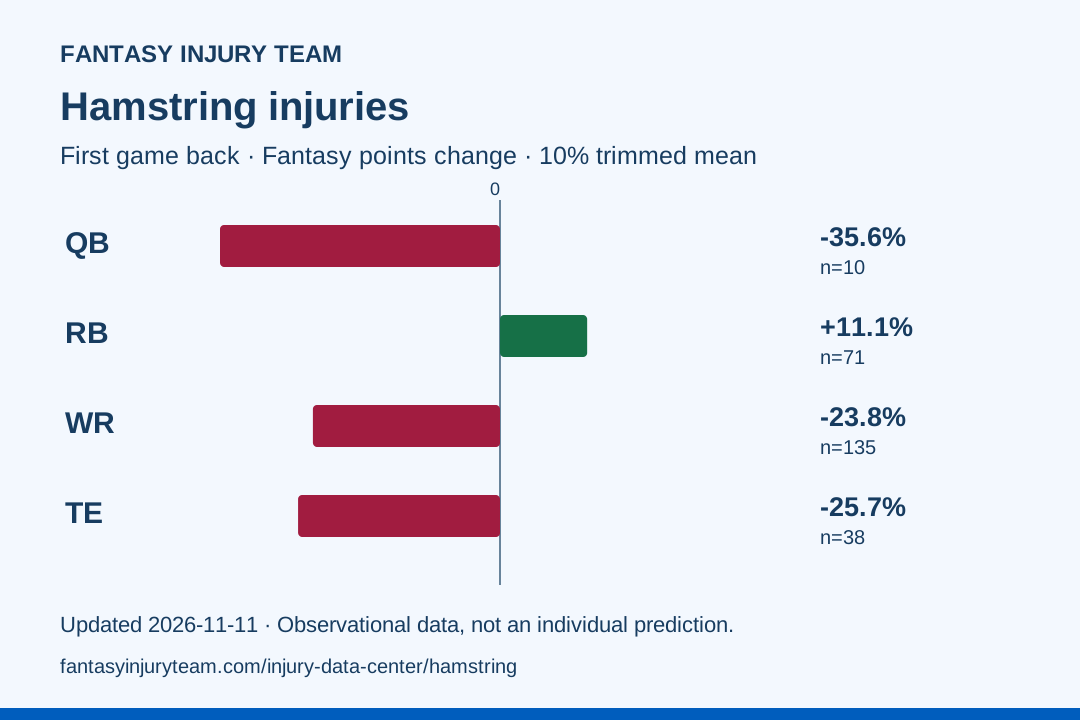
Download this chart · Download summary data
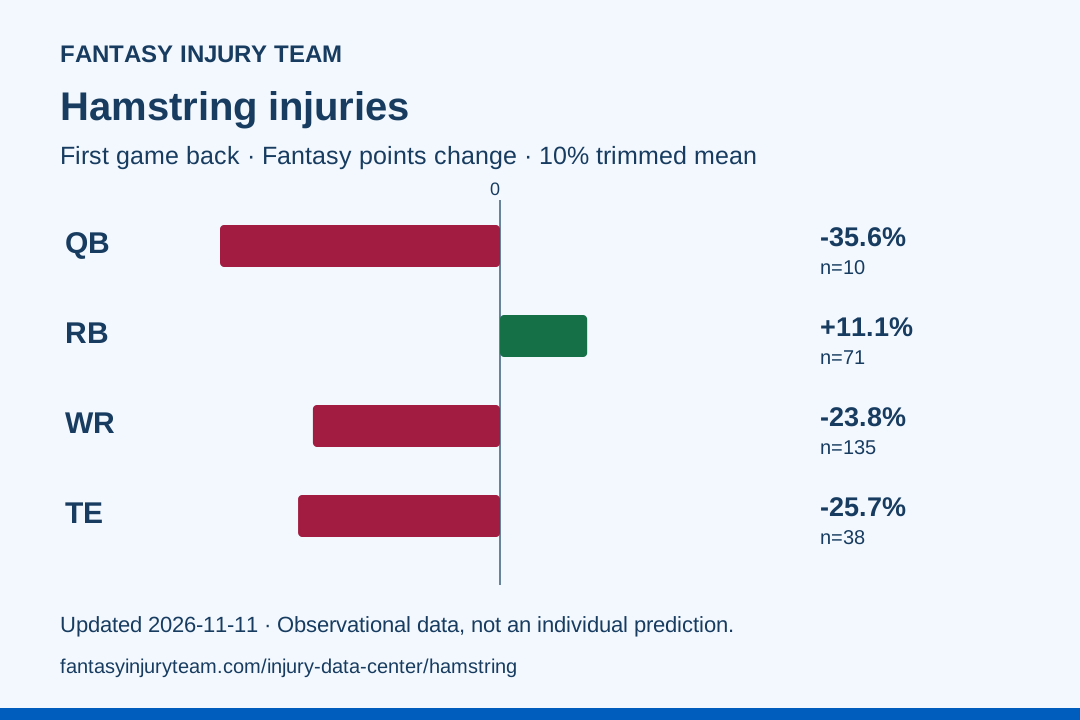
Credit: Fantasy Injury Team. Link to this page when citing the chart; the chart includes the source date and sample sizes.
The people behind the percentages
Individual player episodes
Select a player to expand their injury timeline, baseline, and return-game outcomes.
Aggregate position data · Hamstring
| Position | Episodes | Avg games missed | Game 1 | Game 2 | Game 3 | Game 4 | Game 5 | Game 6 |
|---|---|---|---|---|---|---|---|---|
| QB | 17 | 2.1 gamesn=14 | +45.4%n=12 | +51.6%n=10 | +25.5%n=8 · small sample | +137.0%n=5 · small sample | +113.3%n=4 · small sample | +95.5%n=3 · small sample |
| RB | 104 | 1.8 gamesn=82 | -1.6%n=71 | +9.4%n=57 | +3.8%n=41 | -0.7%n=31 | -7.5%n=26 | -8.0%n=19 |
| WR | 220 | 1.6 gamesn=168 | -7.0%n=148 | +3.0%n=120 | +0.8%n=84 | +4.0%n=63 | +2.1%n=46 | +15.3%n=38 |
| TE | 50 | 2.9 gamesn=43 | -7.6%n=41 | -2.7%n=34 | -4.1%n=28 | +1.1%n=23 | -0.4%n=15 | -5.2%n=14 |
104 matching episodes · Hamstring · RB.
| Player / team | Injury timing | Games missed | G1 snap Δ | G2 snap Δ | G3 snap Δ | G4 snap Δ | G5 snap Δ | G6 snap Δ |
|---|---|---|---|---|---|---|---|---|
Marshawn LloydHamstring | 2024 Preseason | — | — | — | — | — | — | — |
Chuba HubbardHamstring | 2023 Week 16 | 0.0 | +23.0% | +42.3% | — | — | — | — |
Brian RobinsonHamstring | 2023 Week 13 | 2.0 | +4.2% | -17.0% | — | — | — | — |
Breece HallHamstring | 2023 Week 12 | — | — | — | — | — | — | — |
Keaton MitchellHamstring | 2023 Week 10 | 0.0 | +128.6% | +242.9% | +338.1% | +214.3% | — | — |
Pierre StrongHamstring | 2023 Week 9 | 1.0 | -76.5% | -82.4% | -17.6% | -58.8% | 0.0% | -5.9% |
Chase BrownHamstring | 2023 Week 8 | 5.0 | +476.9% | +1053.8% | — | — | — | — |
Gary BrightwellHamstring | 2023 Week 7 | — | — | — | — | — | — | — |
Keaton MitchellHamstring | 2023 Week 7 | 1.0 | — | — | — | — | — | — |
Craig ReynoldsHamstring | 2023 Week 6 | 0.0 | -46.3% | +67.2% | -70.1% | -82.1% | -94.0% | -82.1% |
Zach CharbonnetHamstring | 2023 Week 6 | 1.0 | +101.7% | +88.0% | +77.8% | +190.6% | +200.9% | — |
Jahmyr GibbsHamstring | 2023 Week 5 | 2.0 | +102.3% | +62.8% | +34.9% | +30.2% | +65.1% | +4.7% |
Aaron JonesHamstring | 2023 Week 4 | 1.0 | -23.4% | +8.5% | +21.3% | — | — | — |
Jamaal WilliamsHamstring | 2023 Week 2 | 4.0 | -70.7% | -69.3% | -42.7% | -70.7% | -62.7% | — |
Isiah PachecoHamstring | 2023 Week 2 | — | — | — | — | — | — | — |
Aaron JonesHamstring | 2023 Week 1 | — | — | — | — | — | — | — |
Jerome FordHamstring | 2023 Preseason | 0.0 | +256.5% | +326.1% | — | — | — | — |
Kendre MillerHamstring | 2023 Preseason | 2.0 | — | — | — | — | — | — |
Jaylen WarrenHamstring | 2022 Week 11 | 1.0 | -37.5% | +25.0% | +6.3% | -3.1% | +25.0% | +31.3% |
Damien HarrisHamstring | 2022 Week 5 | 1.0 | -58.0% | +1.2% | — | — | — | — |
Justice HillHamstring | 2022 Week 4 | 2.0 | -9.7% | -38.8% | -27.2% | +19.4% | -44.7% | -30.1% |
Brandon BoldenHamstring | 2022 Week 1 | 1.0 | +10.1% | -78.6% | -51.1% | -93.9% | -78.6% | — |
Dontrell HilliardHamstring | 2022 Week 1 | 1.0 | -39.8% | -22.2% | -22.2% | -27.2% | -29.7% | — |
Leonard FournetteHamstring | 2022 Week 1 | 0.0 | +37.2% | +43.5% | -3.8% | -2.3% | +29.3% | -5.4% |
Elijah MitchellHamstring | 2022 Preseason | — | — | — | — | — | — | — |
Miles SandersHamstring | 2022 Preseason | 0.0 | -3.7% | -1.9% | — | — | — | — |
Leonard FournetteHamstring | 2021 Week 15 | — | — | — | — | — | — | — |
Damien HarrisHamstring | 2021 Week 13 | 1.0 | +9.5% | -49.8% | +9.5% | — | — | — |
Rashaad PennyHamstring | 2021 Week 11 | 1.0 | +80.9% | +151.5% | +85.3% | — | — | — |
Ty MontgomeryHamstring | 2021 Week 8 | — | — | — | — | — | — | — |
Christian McCaffreyHamstring | 2021 Week 3 | 5.0 | -38.8% | -26.3% | +12.5% | — | — | — |
Austin EkelerHamstring | 2021 Preseason | 0.0 | +2.7% | — | — | — | — | — |
Kareem HuntHamstring | 2020 Week 12 | 0.0 | -16.4% | -19.9% | -42.5% | -25.1% | -2.4% | — |
Matt BreidaHamstring | 2020 Week 12 | 2.0 | +15.6% | — | — | — | — | — |
Ty MontgomeryHamstring | 2020 Week 11 | 4.0 | +162.5% | +762.5% | — | — | — | — |
Carlos HydeHamstring | 2020 Week 7 | 3.0 | +165.8% | — | — | — | — | — |
Austin EkelerHamstring | 2020 Week 4 | 6.0 | +9.6% | -8.6% | — | — | — | — |
Leveon BellHamstring | 2020 Week 1 | 3.0 | -19.4% | -60.3% | -68.7% | -62.7% | -68.7% | -63.9% |
Miles SandersHamstring | 2020 Preseason | 1.0 | +46.7% | — | — | — | — | — |
Derrick HenryHamstring | 2019 Week 15 | 1.0 | +19.3% | — | — | — | — | — |
Darrel WilliamsHamstring | 2019 Week 13 | — | — | — | — | — | — | — |
Chase EdmondsHamstring | 2019 Week 8 | 4.0 | -45.3% | -82.7% | — | — | — | — |
Devin SingletaryHamstring | 2019 Week 2 | 3.0 | -44.1% | 0.0% | -2.9% | 0.0% | +7.4% | +2.9% |
Rashaad PennyHamstring | 2019 Week 2 | 2.0 | -44.4% | -88.9% | +11.1% | -44.4% | -85.2% | +81.5% |
Lesean McCoyHamstring | 2018 Week 14 | 1.0 | -11.5% | -13.2% | — | — | — | — |
Spencer WareHamstring | 2018 Week 14 | 15.0 | +51.5% | +55.3% | — | — | — | — |
Ronald JonesHamstring | 2018 Week 8 | 4.0 | -48.1% | -77.8% | -70.4% | -92.6% | — | — |
Melvin GordonHamstring | 2018 Week 6 | 1.0 | +22.6% | +11.4% | — | — | — | — |
Leonard FournetteHamstring | 2018 Week 4 | 4.0 | +57.6% | +54.5% | +33.3% | +133.3% | — | — |
Dalvin CookHamstring | 2018 Week 4 | 4.0 | -23.0% | +18.9% | -20.3% | +4.1% | +16.2% | -17.6% |
Snapshot updated November 11, 2026. All tables use the same 2,413-episode source snapshot. Historical comparisons are observational; they do not establish that an injury caused a particular performance change. Read the methodology and limitations.