
Compare fantasy points, snap share and games missed after NFL hamstring injuries, with receiver, running back, quarterback and tight end data.
391 recorded episodes · Updated November 11, 2026 · Half-PPR fantasy scoring
How does fantasy production change after return?
| Position | Episodes | Avg games missed | Game 1 | Game 2 | Game 3 | Game 4 | Game 5 | Game 6 |
|---|---|---|---|---|---|---|---|---|
| QB | 17 | 2.1 gamesn=14 | -35.6%n=10 | -55.4%n=8 · small sample | -26.4%n=7 · small sample | -63.4%n=4 · small sample | -48.5%n=3 · small sample | -97.5%n=2 · small sample |
| RB | 104 | 1.8 gamesn=82 | +11.1%n=71 | +19.2%n=57 | +25.0%n=41 | -0.7%n=31 | -1.5%n=26 | +15.4%n=19 |
| WR | 220 | 1.6 gamesn=168 | -23.8%n=135 | -3.0%n=112 | -0.9%n=77 | +9.3%n=60 | -1.1%n=43 | +8.5%n=36 |
| TE | 50 | 2.9 gamesn=43 | -25.7%n=38 | -33.2%n=31 | +16.3%n=25 | -29.7%n=22 | -11.1%n=15 | -3.9%n=14 |
Each game has its own eligible sample. These are historical comparisons, not a prediction for an individual player.
QB: first game back
-35.6% fantasy production change across 10 eligible observations.
2.1 games missed on average across 14 recorded values.
RB: first game back
+11.1% fantasy production change across 71 eligible observations.
1.8 games missed on average across 82 recorded values.
WR: first game back
-23.8% fantasy production change across 135 eligible observations.
1.6 games missed on average across 168 recorded values.
TE: first game back
-25.7% fantasy production change across 38 eligible observations.
2.9 games missed on average across 43 recorded values.
What the numbers mean for fantasy football
Hamstrings take on substantial load during sprinting. Pain or weakness can limit acceleration and separation, especially for receivers who depend on speed. A return to the lineup does not necessarily mean a return to full explosiveness. Compare the first game back with later games rather than treating every return as the same.
Role, age, workload, associated injuries and the type of treatment can all differ between episodes. Read the diagnosis and practice report alongside these data; the averages cannot confirm readiness or a return date.
Shareable first-game comparison
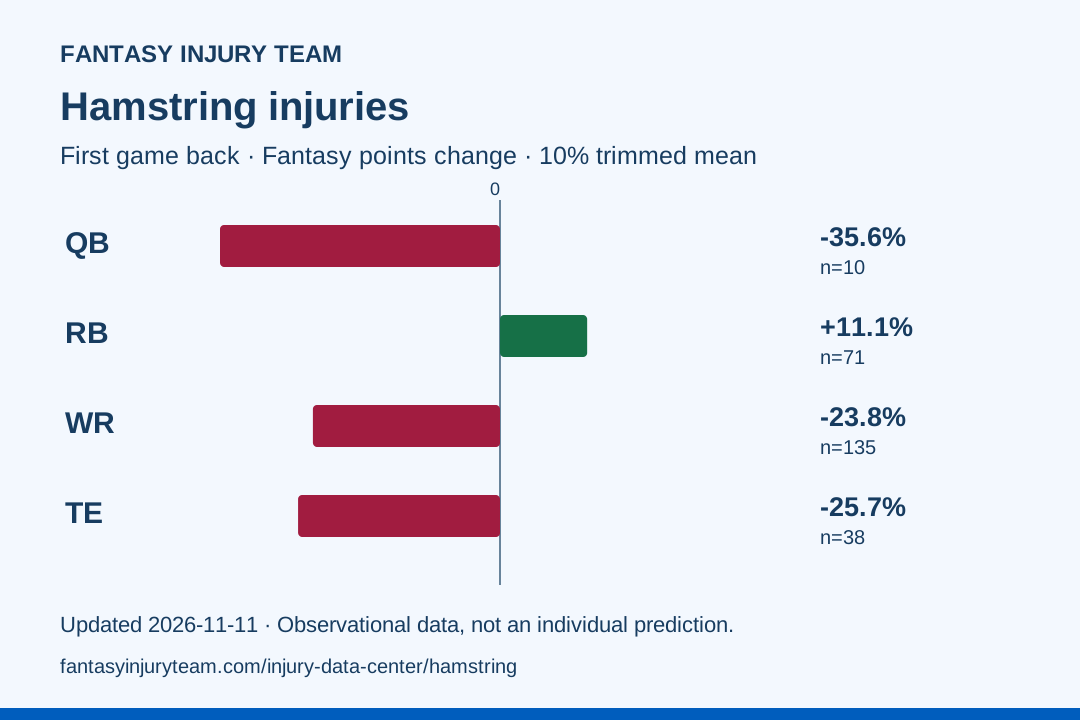
Download this chart · Download summary data
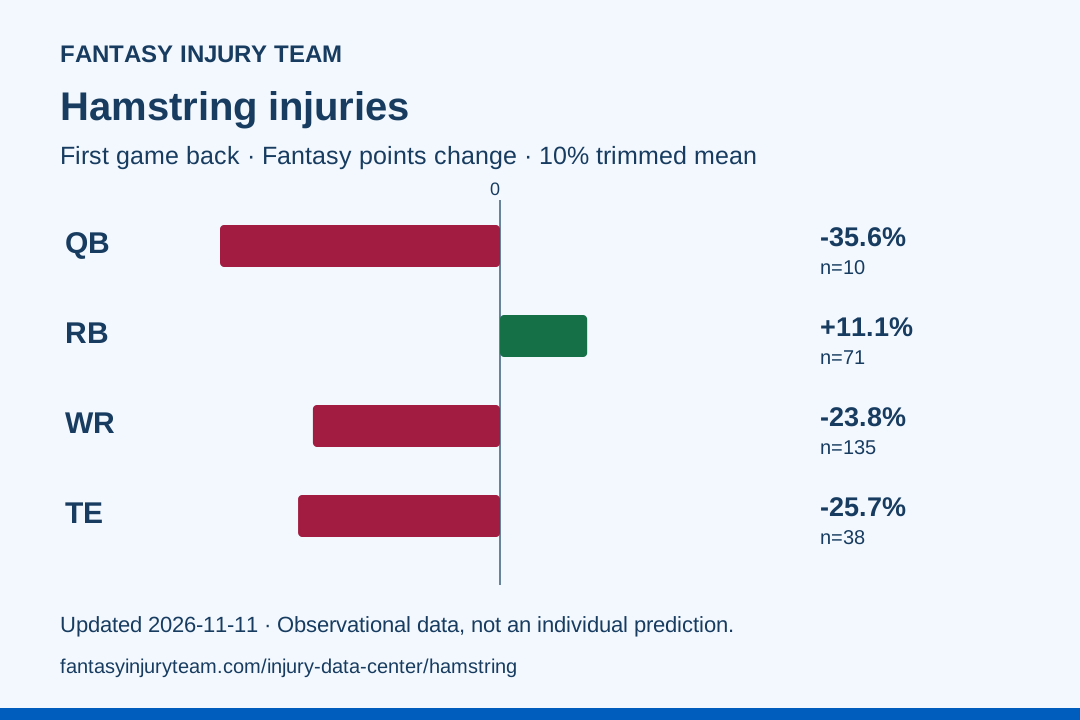
Credit: Fantasy Injury Team. Link to this page when citing the chart; the chart includes the source date and sample sizes.
The people behind the percentages
Individual player episodes
Select a player to expand their injury timeline, baseline, and return-game outcomes.
Aggregate position data · Hamstring
| Position | Episodes | Avg games missed | Game 1 | Game 2 | Game 3 | Game 4 | Game 5 | Game 6 |
|---|---|---|---|---|---|---|---|---|
| QB | 17 | 2.1 gamesn=14 | -35.6%n=10 | -55.4%n=8 · small sample | -26.4%n=7 · small sample | -63.4%n=4 · small sample | -48.5%n=3 · small sample | -97.5%n=2 · small sample |
| RB | 104 | 1.8 gamesn=82 | +11.1%n=71 | +19.2%n=57 | +25.0%n=41 | -0.7%n=31 | -1.5%n=26 | +15.4%n=19 |
| WR | 220 | 1.6 gamesn=168 | -23.8%n=135 | -3.0%n=112 | -0.9%n=77 | +9.3%n=60 | -1.1%n=43 | +8.5%n=36 |
| TE | 50 | 2.9 gamesn=43 | -25.7%n=38 | -33.2%n=31 | +16.3%n=25 | -29.7%n=22 | -11.1%n=15 | -3.9%n=14 |
220 matching episodes · Hamstring · WR.
| Player / team | Injury timing | Games missed | G1 PPG Δ | G2 PPG Δ | G3 PPG Δ | G4 PPG Δ | G5 PPG Δ | G6 PPG Δ |
|---|---|---|---|---|---|---|---|---|
Nico CollinsHamstring | 2024 Week 3 | 0.0 | +41.9% | — | — | — | — | — |
Greg DortchHamstring | 2024 Week 2 | 0.0 | -38.3% | -28.4% | -85.2% | -61.7% | -13.6% | -82.7% |
AJ BrownHamstring | 2024 Week 1 | 3.0 | +48.0% | +25.0% | -21.7% | — | — | — |
Ricky PearsallHamstring | 2024 Preseason | — | — | — | — | — | — | — |
Tee HigginsHamstring | 2024 Preseason | 2.0 | -44.4% | -7.4% | +155.2% | — | — | — |
Rashee RiceHamstring | 2023 Week 17 | 1.0 | +31.2% | +52.1% | — | — | — | — |
Tee HigginsHamstring | 2023 Week 17 | — | — | — | — | — | — | — |
Marvin MimsHamstring | 2023 Week 16 | 1.0 | -35.4% | — | — | — | — | — |
Zay JonesHamstring | 2023 Week 15 | 2.0 | +19.8% | — | — | — | — | — |
Christian WatsonHamstring | 2023 Week 13 | 5.0 | +11.4% | -100.0% | — | — | — | — |
Tee HigginsHamstring | 2023 Week 10 | 3.0 | -38.8% | -1.5% | +141.3% | +170.2% | — | — |
Devonta SmithHamstring | 2023 Week 6 | 0.0 | -34.3% | +84.8% | +20.0% | — | — | — |
Tyler LockettHamstring | 2023 Week 6 | 0.0 | -39.3% | +89.5% | -50.8% | +101.0% | -20.4% | -52.9% |
Justin JeffersonHamstring | 2023 Week 5 | — | — | — | — | — | — | — |
Quez WatkinsHamstring | 2023 Week 5 | 5.0 | — | — | — | — | — | — |
Mike EvansHamstring | 2023 Week 4 | 0.0 | -63.2% | -8.2% | -39.1% | — | — | — |
Rashod BatemanHamstring | 2023 Week 3 | 1.0 | -68.7% | -39.8% | +10.8% | +49.4% | — | — |
DeVonta SmithHamstring | 2023 Week 2 | 0.0 | -66.2% | -20.4% | — | — | — | — |
Quez WatkinsHamstring | 2023 Week 2 | — | — | — | — | — | — | — |
Diontae JohnsonHamstring | 2023 Week 1 | 4.0 | +28.4% | +54.3% | +128.4% | — | — | — |
George PickensHamstring | 2023 Week 1 | 0.0 | +150.5% | +14.9% | -51.6% | +185.6% | +59.7% | +5.3% |
Jerry JeudyHamstring | 2023 Preseason | 1.0 | -64.9% | — | — | — | — | — |
DJ CharkHamstring | 2023 Preseason | 2.0 | -73.6% | +119.5% | -49.8% | +54.7% | -45.8% | -56.4% |
Jameson WilliamsHamstring | 2023 Preseason | 4.0 | -50.7% | +405.5% | -100.0% | +6.8% | +15.1% | +368.5% |
Justyn RossHamstring | 2023 Preseason | 0.0 | — | — | — | — | — | — |
Chase ClaypoolHamstring | 2023 Preseason | 0.0 | -100.0% | +102.9% | — | — | — | — |
Damiere ByrdHamstring | 2023 Preseason | 8.0 | — | — | — | — | — | — |
Cooper KuppHamstring | 2023 Preseason | 4.0 | -13.2% | +33.4% | -67.6% | -77.5% | — | — |
Christian WatsonHamstring | 2023 Preseason | 3.0 | -7.4% | -1.5% | — | — | — | — |
John MetchieHamstring | 2023 Preseason | 1.0 | — | — | — | — | — | — |
Marquise BrownHamstring | 2023 Preseason | 0.0 | -29.5% | +41.1% | — | — | — | — |
Romeo DoubsHamstring | 2023 Preseason | 0.0 | +167.7% | -35.5% | +154.8% | +125.8% | -85.5% | +61.3% |
Tee HigginsHamstring | 2022 Week 14 | 0.0 | — | — | — | — | — | — |
Courtland SuttonHamstring | 2022 Week 13 | 2.0 | -3.4% | -30.5% | +17.3% | — | — | — |
Tee HigginsHamstring | 2022 Week 13 | — | — | — | — | — | — | — |
Devin DuvernayHamstring | 2022 Week 11 | 0.0 | -34.1% | -11.0% | -100.0% | — | — | — |
Kadarius ToneyHamstring | 2022 Week 11 | 3.0 | -82.2% | +29.8% | +61.8% | +102.7% | — | — |
Deandre HopkinsHamstring | 2022 Week 10 | 0.0 | -25.5% | -8.6% | -48.5% | -48.0% | — | — |
Desean JacksonHamstring | 2022 Week 9 | 2.0 | — | — | — | — | — | — |
Deebo SamuelHamstring | 2022 Week 7 | 1.0 | -52.8% | +46.1% | — | — | — | — |
Keenan AllenHamstring | 2022 Week 7 | 2.0 | +15.1% | +55.8% | +107.0% | +76.7% | +46.5% | +84.9% |
Russell GageHamstring | 2022 Week 7 | 4.0 | -74.5% | +30.5% | +248.5% | +43.2% | -23.6% | +43.2% |
Tyler LockettHamstring | 2022 Week 6 | 0.0 | -80.3% | — | — | — | — | — |
Christian WatsonHamstring | 2022 Week 5 | — | — | — | — | — | — | — |
Marvin Jones Jr.Hamstring | 2022 Week 5 | 1.0 | +40.6% | -100.0% | +33.3% | -30.6% | +77.2% | -59.8% |
Nelson AgholorHamstring | 2022 Week 5 | 1.0 | -100.0% | -91.1% | -100.0% | -64.4% | +96.8% | -65.7% |
Juju Smith-SchusterHamstring | 2022 Week 5 | 0.0 | -35.8% | +164.9% | +193.0% | +84.6% | — | — |
Jahan DotsonHamstring | 2022 Week 4 | 5.0 | -83.4% | -81.7% | -100.0% | +21.2% | +61.3% | +44.8% |
Laviska ShenaultHamstring | 2022 Week 4 | 2.0 | -91.9% | -68.1% | -96.3% | -16.2% | -83.1% | -80.6% |
Christian WatsonHamstring | 2022 Week 2 | — | — | — | — | — | — | — |
Snapshot updated November 11, 2026. All tables use the same 2,413-episode source snapshot. Historical comparisons are observational; they do not establish that an injury caused a particular performance change. Read the methodology and limitations.