
NFL foot injury recovery data showing recorded games missed and fantasy performance after return by position, with sample sizes and methodology.
81 recorded episodes · Updated November 11, 2026 · Half-PPR fantasy scoring
How does fantasy production change after return?
| Position | Episodes | Avg games missed | Game 1 | Game 2 | Game 3 | Game 4 | Game 5 | Game 6 |
|---|---|---|---|---|---|---|---|---|
| QB | 8 | 3.5 gamesn=4 | +188.2%n=2 · small sample | +222.6%n=2 · small sample | +108.6%n=1 · small sample | +235.4%n=1 · small sample | -103.4%n=1 · small sample | +242.5%n=1 · small sample |
| RB | 26 | 2.6 gamesn=22 | -34.0%n=19 | -8.3%n=16 | -28.6%n=12 | -5.5%n=10 | -35.4%n=9 · small sample | -27.8%n=7 · small sample |
| WR | 36 | 1.3 gamesn=32 | -40.8%n=26 | -23.4%n=18 | -27.1%n=12 | -38.5%n=8 · small sample | +35.0%n=5 · small sample | -28.6%n=3 · small sample |
| TE | 11 | 0.5 gamesn=8 | -12.1%n=8 · small sample | +46.9%n=7 · small sample | -18.7%n=5 · small sample | -0.8%n=3 · small sample | +89.2%n=2 · small sample | -75.9%n=1 · small sample |
Each game has its own eligible sample. These are historical comparisons, not a prediction for an individual player.
QB: first game back
+188.2% fantasy production change across 2 eligible observations.
3.5 games missed on average across 4 recorded values.
Small sample: interpret cautiously.
RB: first game back
-34.0% fantasy production change across 19 eligible observations.
2.6 games missed on average across 22 recorded values.
WR: first game back
-40.8% fantasy production change across 26 eligible observations.
1.3 games missed on average across 32 recorded values.
TE: first game back
-12.1% fantasy production change across 8 eligible observations.
0.5 games missed on average across 8 recorded values.
Small sample: interpret cautiously.
What the numbers mean for fantasy football
The foot must tolerate force when a player plants, cuts and accelerates. This broad category includes different diagnoses, so the results should not be treated as a forecast for a specific fracture or sprain. Use the confirmed diagnosis and the player's role alongside the historical numbers.
Role, age, workload, associated injuries and the type of treatment can all differ between episodes. Read the diagnosis and practice report alongside these data; the averages cannot confirm readiness or a return date.
Shareable first-game comparison
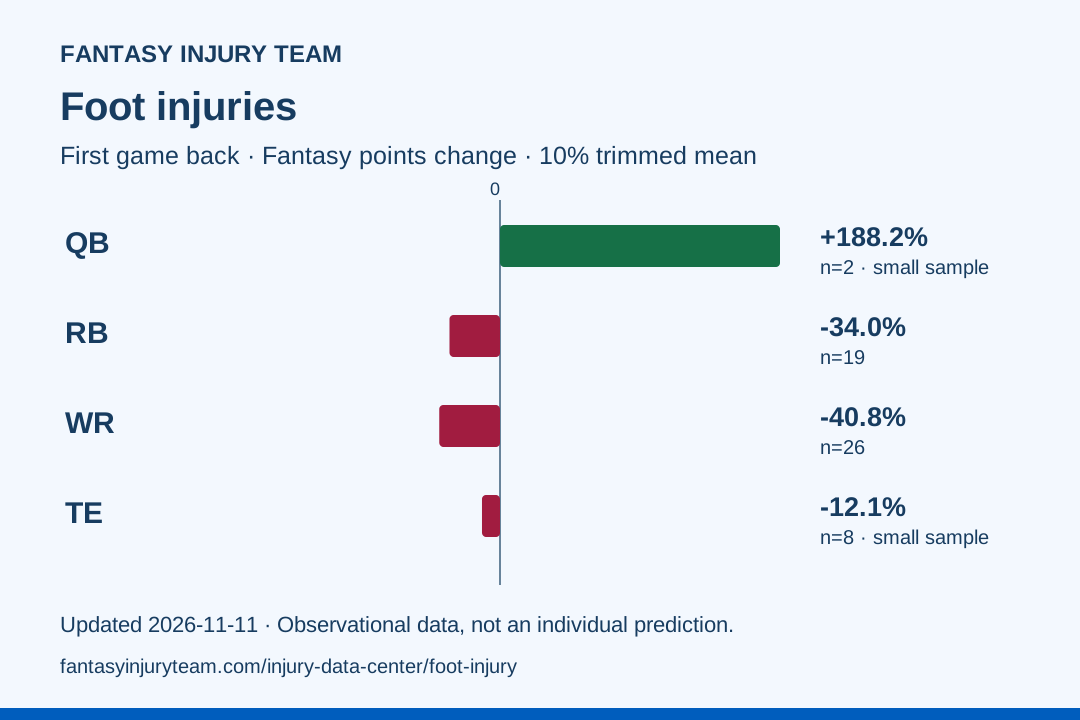
Download this chart · Download summary data
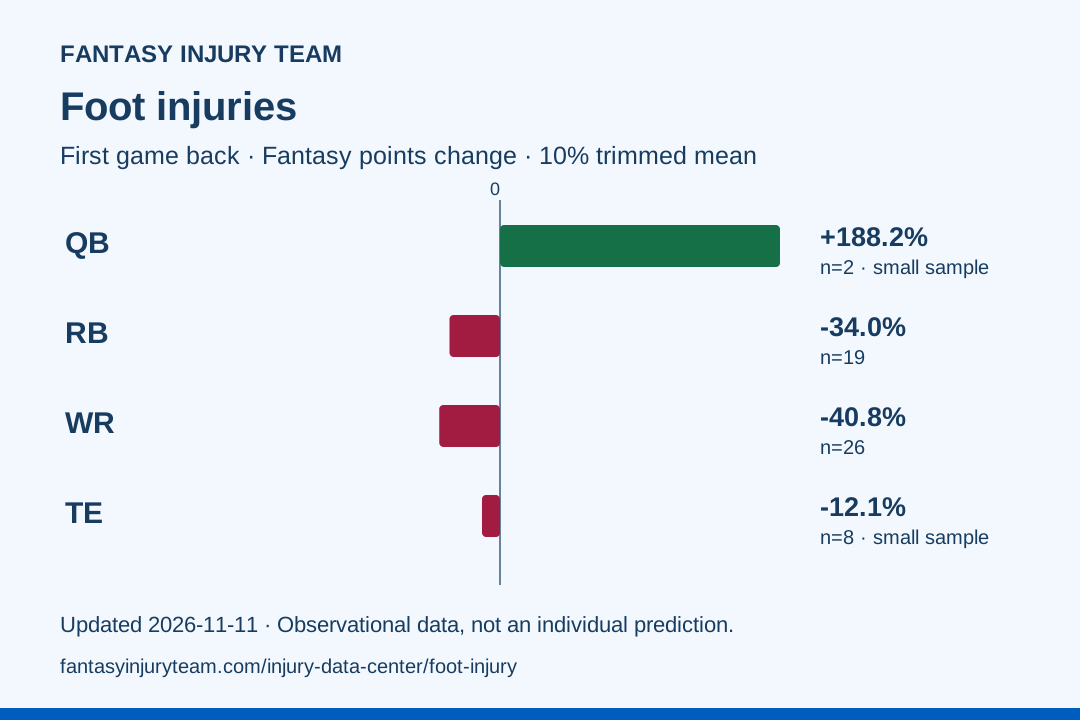
Credit: Fantasy Injury Team. Link to this page when citing the chart; the chart includes the source date and sample sizes.
The people behind the percentages
Individual player episodes
Select a player to expand their injury timeline, baseline, and return-game outcomes.
Aggregate position data · Foot Injury
| Position | Episodes | Avg games missed | Game 1 | Game 2 | Game 3 | Game 4 | Game 5 | Game 6 |
|---|---|---|---|---|---|---|---|---|
| QB | 8 | 3.5 gamesn=4 | +1.2%n=2 · small sample | -49.5%n=2 · small sample | 0.0%n=1 · small sample | 0.0%n=1 · small sample | -38.0%n=1 · small sample | 0.0%n=1 · small sample |
| RB | 26 | 2.6 gamesn=22 | -24.8%n=20 | -5.9%n=17 | -14.7%n=13 | -4.9%n=11 | -18.6%n=10 | -33.9%n=8 · small sample |
| WR | 36 | 1.3 gamesn=32 | -12.1%n=28 | -16.9%n=20 | -0.1%n=14 | +5.3%n=10 | +18.5%n=6 · small sample | +9.7%n=4 · small sample |
| TE | 11 | 0.5 gamesn=8 | -14.0%n=8 · small sample | +10.2%n=7 · small sample | +24.1%n=5 · small sample | -2.9%n=3 · small sample | -12.7%n=2 · small sample | +18.0%n=1 · small sample |
81 matching episodes · Foot Injury · All positions.
| Player / team | Injury timing | Games missed | G1 snap Δ | G2 snap Δ | G3 snap Δ | G4 snap Δ | G5 snap Δ | G6 snap Δ |
|---|---|---|---|---|---|---|---|---|
Rachaad WhiteFoot Injury | 2024 Week 5 | 1.0 | -29.7% | -17.9% | -9.2% | -10.6% | -28.2% | -22.3% |
Najee HarrisFoot Injury | 2022 Preseason | 0.0 | -29.6% | -15.3% | -4.6% | -10.5% | -41.5% | -17.7% |
Travis EtienneFoot Injury | 2021 Preseason | 17.0 | — | — | — | — | — | — |
Chris CarsonFoot Injury | 2020 Week 7 | 4.0 | -33.7% | +3.9% | -19.4% | +25.4% | +12.9% | -17.6% |
Joe MixonFoot Injury | 2020 Week 6 | 10.0 | +14.7% | +23.5% | — | — | — | — |
Marvin HarrisonFoot Injury | 2025 Week 17 | 1.0 | — | — | — | — | — | — |
Tim PatrickFoot Injury | 2025 Week 16 | 0.0 | -48.5% | +9.1% | — | — | — | — |
Tetairoa McMillanFoot Injury | 2025 Week 15 | 0.0 | -0.8% | -5.4% | +0.4% | — | — | — |
Ladd McConkeyFoot Injury | 2025 Week 14 | 0.0 | -3.1% | -1.7% | +16.6% | — | — | — |
Rome OdunzeFoot Injury | 2025 Week 13 | — | — | — | — | — | — | — |
Savion WilliamsFoot Injury | 2025 Week 9 | 0.0 | -21.3% | -65.0% | +5.0% | -65.0% | — | — |
Isaiah BondFoot Injury | 2025 Week 8 | 1.0 | -21.4% | -45.7% | -45.7% | -10.2% | +27.3% | -10.2% |
KaVontae TurpinFoot Injury | 2025 Week 4 | 2.0 | -29.7% | -3.9% | -55.5% | — | — | — |
Sterling ShepardFoot Injury | 2025 Week 4 | 0.0 | -38.5% | -26.5% | -4.0% | -38.5% | -2.5% | — |
Wan'Dale RobinsonFoot Injury | 2025 Week 2 | 0.0 | +1.3% | +27.6% | +25.0% | +27.6% | +19.7% | +28.9% |
Jayden ReedFoot Injury | 2025 Preseason | 0.0 | -39.9% | — | — | — | — | — |
Josh PalmerFoot Injury | 2024 Week 17 | — | — | — | — | — | — | — |
Rashod BatemanFoot Injury | 2024 Week 15 | 0.0 | +16.9% | -36.5% | — | — | — | — |
Sterling ShepardFoot Injury | 2024 Week 14 | 0.0 | -9.4% | — | — | — | — | — |
Curtis SamuelFoot Injury | 2024 Week 13 | — | — | — | — | — | — | — |
Tyler BoydFoot Injury | 2024 Week 13 | 0.0 | -3.1% | -8.1% | -16.3% | +23.1% | — | — |
Rashod BatemanFoot Injury | 2022 Week 8 | 9.0 | -32.5% | — | — | — | — | — |
Rashod BatemanFoot Injury | 2022 Week 4 | 2.0 | -11.1% | — | — | — | — | — |
Alshon JefferyFoot Injury | 2019 Week 14 | 11.0 | -64.7% | -90.9% | -36.0% | -26.9% | -41.2% | -19.0% |
Jake TongesFoot Injury | 2025 Divisional round | — | — | — | — | — | — | — |
Chig OkonkwoFoot Injury | 2025 Week 12 | 0.0 | -10.0% | -29.2% | -15.9% | -33.6% | -24.8% | +18.0% |
Isaiah LikelyFoot Injury | 2025 Preseason | 3.0 | -24.2% | -10.7% | +36.4% | -2.3% | -0.6% | — |
Kyle PittsFoot Injury | 2025 Week ? | — | — | — | — | — | — | — |
Hunter HenryFoot Injury | 2024 Week 17 | 1.0 | +13.1% | +3.4% | — | — | — | — |
Juwan JohnsonFoot Injury | 2024 Week 13 | 0.0 | +22.4% | +24.1% | +24.1% | — | — | — |
George KittleFoot Injury | 2024 Week 7 | — | — | — | — | — | — | — |
Snapshot updated November 11, 2026. All tables use the same 2,413-episode source snapshot. Historical comparisons are observational; they do not establish that an injury caused a particular performance change. Read the methodology and limitations.