
Explore NFL ACL injury episodes, recorded time missed and fantasy performance after return for quarterbacks, running backs, receivers and tight ends.
75 recorded episodes · Updated November 11, 2026 · Half-PPR fantasy scoring
How does fantasy production change after return?
| Position | Episodes | Avg games missed | Game 1 | Game 2 | Game 3 | Game 4 | Game 5 | Game 6 |
|---|---|---|---|---|---|---|---|---|
| QB | 9 | 9.9 gamesn=9 | -22.0%n=9 · small sample | +5.7%n=9 · small sample | +12.9%n=9 · small sample | -0.5%n=8 · small sample | +5.0%n=7 · small sample | -15.0%n=7 · small sample |
| RB | 20 | 15.1 gamesn=13 | -25.0%n=15 | -49.1%n=14 | -58.8%n=11 | +7.1%n=8 · small sample | +8.0%n=6 · small sample | -10.2%n=6 · small sample |
| WR | 34 | 12.0 gamesn=27 | -39.3%n=19 | -35.2%n=18 | -35.4%n=18 | -8.7%n=17 | -10.2%n=17 | -48.0%n=17 |
| TE | 12 | 14.1 gamesn=11 | -34.6%n=12 | -30.8%n=12 | -43.9%n=12 | -27.4%n=10 | -43.7%n=10 | -9.2%n=9 · small sample |
Each game has its own eligible sample. These are historical comparisons, not a prediction for an individual player.
QB: first game back
-22.0% fantasy production change across 9 eligible observations.
9.9 games missed on average across 9 recorded values.
Small sample: interpret cautiously.
RB: first game back
-25.0% fantasy production change across 15 eligible observations.
15.1 games missed on average across 13 recorded values.
WR: first game back
-39.3% fantasy production change across 19 eligible observations.
12.0 games missed on average across 27 recorded values.
TE: first game back
-34.6% fantasy production change across 12 eligible observations.
14.1 games missed on average across 11 recorded values.
What the numbers mean for fantasy football
An ACL injury can create a prolonged rehabilitation process. Restoring strength, movement control and confidence in changing direction matters beyond the return date. These records may span seasons, and associated injuries or different treatment approaches can change recovery. Do not treat the category average as an individual surgical timeline.
Role, age, workload, associated injuries and the type of treatment can all differ between episodes. Read the diagnosis and practice report alongside these data; the averages cannot confirm readiness or a return date.
Shareable first-game comparison
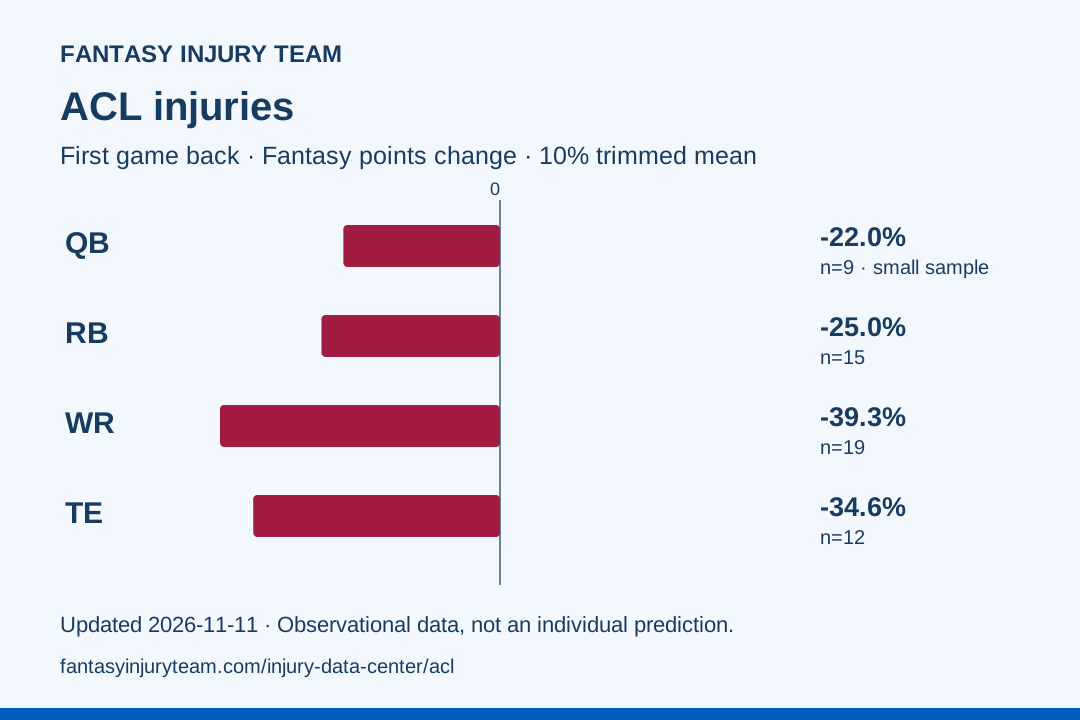
Download this chart · Download summary data
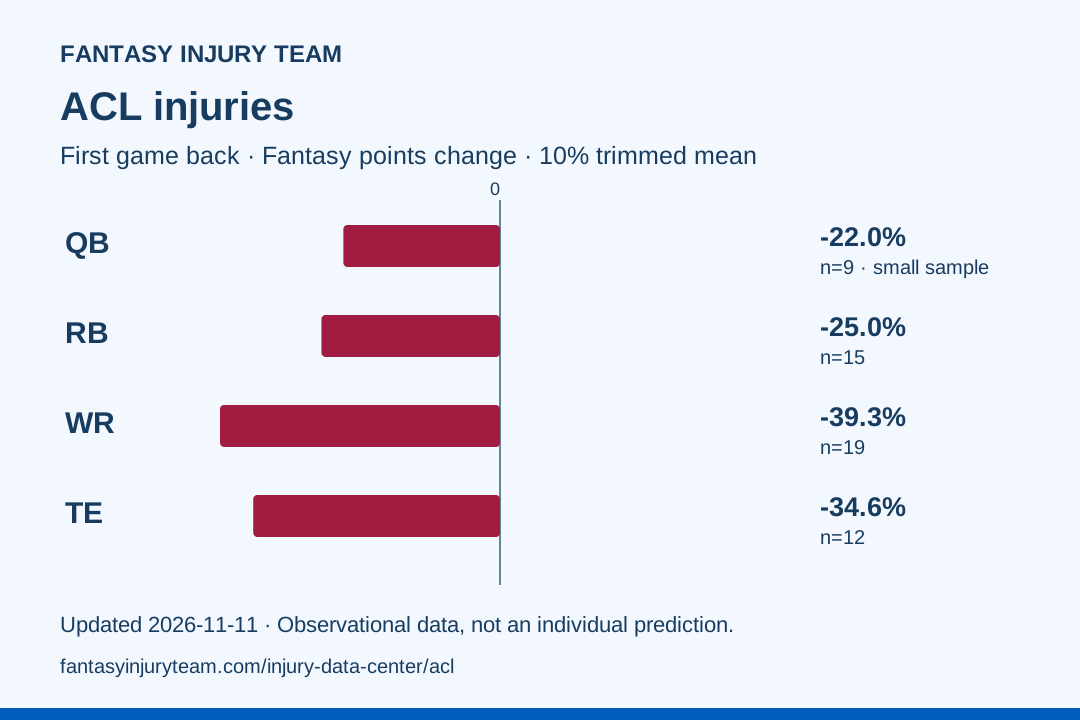
Credit: Fantasy Injury Team. Link to this page when citing the chart; the chart includes the source date and sample sizes.
The people behind the percentages
Individual player episodes
Select a player to expand their injury timeline, baseline, and return-game outcomes.
Aggregate position data · ACL
| Position | Episodes | Avg games missed | Game 1 | Game 2 | Game 3 | Game 4 | Game 5 | Game 6 |
|---|---|---|---|---|---|---|---|---|
| QB | 9 | 9.9 gamesn=9 | -22.0%n=9 · small sample | +5.7%n=9 · small sample | +12.9%n=9 · small sample | -0.5%n=8 · small sample | +5.0%n=7 · small sample | -15.0%n=7 · small sample |
| RB | 20 | 15.1 gamesn=13 | -25.0%n=15 | -49.1%n=14 | -58.8%n=11 | +7.1%n=8 · small sample | +8.0%n=6 · small sample | -10.2%n=6 · small sample |
| WR | 34 | 12.0 gamesn=27 | -39.3%n=19 | -35.2%n=18 | -35.4%n=18 | -8.7%n=17 | -10.2%n=17 | -48.0%n=17 |
| TE | 12 | 14.1 gamesn=11 | -34.6%n=12 | -30.8%n=12 | -43.9%n=12 | -27.4%n=10 | -43.7%n=10 | -9.2%n=9 · small sample |
34 matching episodes · ACL · WR.
| Player / team | Injury timing | Games missed | G1 PPG Δ | G2 PPG Δ | G3 PPG Δ | G4 PPG Δ | G5 PPG Δ | G6 PPG Δ |
|---|---|---|---|---|---|---|---|---|
Calvin Austin IIIRight knee ACL tear | 2026 Preseason | 8.0 | — | — | — | — | — | — |
Jayden HigginsKnee ACL tear | 2026 Preseason | 8.0 | — | — | — | — | — | — |
Gabe DavisACL | 2025 Wild card | — | — | — | — | — | — | — |
Tyrell ShaversACL | 2025 Wild card | — | — | — | — | — | — | — |
Malik NabersACL tear | 2025 Week 4 | — | -34.1% | -96.0% | -66.1% | +34.4% | +57.0% | +49.7% |
Christian WatsonACL | 2024 Week 18 | 6.0 | +61.9% | +4.8% | -15.2% | +186.8% | +14.1% | +151.3% |
Stefon DiggsACL | 2024 Week 8 | 9.0 | -31.0% | -58.7% | -69.8% | +3.9% | +55.5% | -65.9% |
Brandon AiyukACL | 2024 Week 7 | — | — | — | — | — | — | — |
Braxton BerriosACL | 2024 Week 7 | 16.0 | — | — | — | — | — | — |
Kendrick BourneACL | 2023 Week 8 | 13.0 | -89.1% | -81.1% | -81.1% | -100.0% | -39.3% | +54.1% |
Mike WilliamsACL tear; reconstruction | 2023 Week 3 | 15.0 | -100.0% | -74.9% | -48.7% | -8.9% | -63.4% | -100.0% |
Jameson WilliamsACL tear; reconstruction | 2022 Week ? | 11.0 | — | — | — | — | — | — |
Wan'Dale RobinsonACL | 2022 Week 11 | 9.0 | -18.7% | +42.9% | -12.7% | +102.4% | -46.4% | -66.3% |
Sterling ShepardACL tear; reconstruction | 2022 Week 3 | 14.0 | -100.0% | -91.2% | -100.0% | -89.3% | -82.4% | -100.0% |
Jalen GuytonLeft ACL tear; reconstruction | 2022 Week 3 | 21.0 | — | — | — | — | — | — |
Bisi JohnsonLeft ACL tear; reconstruction | 2022 Preseason | 17.0 | — | — | — | — | — | — |
Tim PatrickRight ACL tear; reconstruction | 2022 Preseason | 17.0 | -72.9% | -84.0% | -23.6% | +2.2% | -56.9% | -100.0% |
Odell Beckham Jr.Left ACL retear; reconstruction | 2021 Super Bowl LVI | 17.0 | -38.6% | -42.5% | -69.9% | -42.5% | -3.3% | -100.0% |
Michael GallupACL tear; reconstruction | 2021 Week 17 | 4.0 | +19.6% | -18.6% | -64.4% | -100.0% | -12.2% | -30.0% |
Chris GodwinACL + MCL tear | 2021 Week 15 | 3.0 | -65.0% | -34.1% | -34.8% | -12.4% | -43.9% | -26.4% |
John MetchieACL | 2021 Week ? | — | — | — | — | — | — | — |
Robert WoodsACL | 2021 Week 10 | 9.0 | -85.9% | -53.7% | -17.6% | -13.7% | -55.3% | -67.8% |
KJ HamlerACL + hip dislocation | 2021 Week 3 | 14.0 | — | — | — | — | — | — |
Odell Beckham Jr.ACL tear | 2020 Week 7 | 11.0 | -10.8% | -67.3% | -76.1% | -17.2% | -73.7% | -91.2% |
Courtland SuttonACL | 2020 Week 2 | 14.0 | -83.7% | — | — | — | — | — |
Preston WilliamsACL | 2019 Week 9 | 8.0 | — | — | — | — | — | — |
Cooper KuppACL | 2018 Week 10 | 6.0 | -47.8% | -2.8% | +77.7% | +44.3% | +43.0% | -76.2% |
Will FullerACL | 2018 Week 8 | 8.0 | -31.7% | -48.1% | -34.3% | -67.1% | +303.7% | -40.3% |
Eli RogersACL | 2017 Playoffs | 13.0 | +100.7% | +35.5% | +341.6% | — | — | — |
Jaelen StrongACL | 2017 Week 16 | — | — | — | — | — | — | — |
Allen RobinsonACL tear; reconstruction | 2017 Week 1 | 15.0 | -20.4% | +30.7% | -36.1% | -8.6% | +46.4% | -91.2% |
Cameron MeredithACL | 2017 Preseason | 18.0 | — | — | — | — | — | — |
Julian EdelmanACL | 2017 Preseason | 20.0 | -19.7% | +23.1% | +5.6% | +41.4% | +25.7% | +31.8% |
Chris BellACL tear | 2025 Week ? | — | — | — | — | — | — | — |
Snapshot updated November 11, 2026. All tables use the same 2,413-episode source snapshot. Historical comparisons are observational; they do not establish that an injury caused a particular performance change. Read the methodology and limitations.